
Page 136 - Electrical Equipment Handbook _ Troubleshooting and Maintenance
P. 136
SPEED CONTROL OF INDUCTION MOTORS
SPEED CONTROL OF INDUCTION MOTORS 7.3
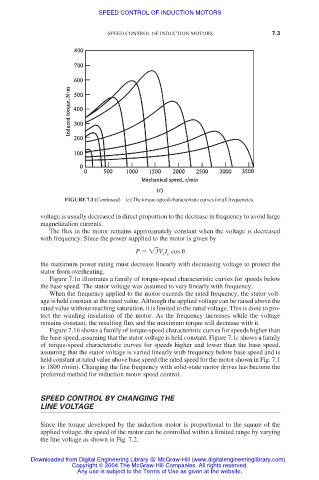
FIGURE 7.1 (Continued)(c) The torque-speed characteristic curves for all frequencies.
voltage is usually decreased in direct proportion to the decrease in frequency to avoid large
magnetization currents.
The flux in the motor remains approximately constant when the voltage is decreased
with frequency. Since the power supplied to the motor is given by
P 3 V I cos
L L
the maximum power rating must decrease linearly with decreasing voltage to protect the
stator from overheating.
Figure 7.1a illustrates a family of torque-speed characteristic curves for speeds below
the base speed. The stator voltage was assumed to vary linearly with frequency.
When the frequency applied to the motor exceeds the rated frequency, the stator volt-
age is held constant at the rated value. Although the applied voltage can be raised above the
rated value without reaching saturation, it is limited to the rated voltage. This is done to pro-
tect the winding insulation of the motor. As the frequency increases while the voltage
remains constant, the resulting flux and the maximum torque will decrease with it.
Figure 7.1b shows a family of torque-speed characteristic curves for speeds higher than
the base speed, assuming that the stator voltage is held constant. Figure 7.1c shows a family
of torque-speed characteristic curves for speeds higher and lower than the base speed,
assuming that the stator voltage is varied linearly with frequency below base speed and is
held constant at rated value above base speed (the rated speed for the motor shown in Fig. 7.1
is 1800 r/min). Changing the line frequency with solid-state motor drives has become the
preferred method for induction motor speed control.
SPEED CONTROL BY CHANGING THE
LINE VOLTAGE
Since the torque developed by the induction motor is proportional to the square of the
applied voltage, the speed of the motor can be controlled within a limited range by varying
the line voltage as shown in Fig. 7.2.
Downloaded from Digital Engineering Library @ McGraw-Hill (www.digitalengineeringlibrary.com)
Copyright © 2004 The McGraw-Hill Companies. All rights reserved.
Any use is subject to the Terms of Use as given at the website.