
Page 265 - Electrical Equipment Handbook _ Troubleshooting and Maintenance
P. 265
SYNCHRONOUS GENERATORS
12.28 CHAPTER TWELVE
On the power diagram, the length corresponding to E is
A
3E V
A
D
E X
S
The length that corresponds to X I on the power diagram is 3V I .
S A
A
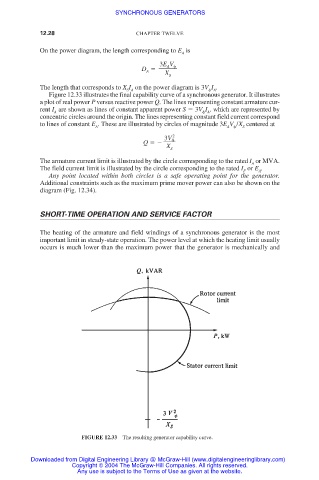
Figure 12.33 illustrates the final capability curve of a synchronous generator. It illustrates
a plot of real power P versus reactive power Q. The lines representing constant armature cur-
rent I are shown as lines of constant apparent power S 3V I , which are represented by
A A
concentric circles around the origin. The lines representing constant field current correspond
to lines of constant E . These are illustrated by circles of magnitude 3E V /X centered at
A A S
2
3V
Q
X
S
The armature current limit is illustrated by the circle corresponding to the rated I or MVA.
A
The field current limit is illustrated by the circle corresponding to the rated I or E .
F A
Any point located within both circles is a safe operating point for the generator.
Additional constraints such as the maximum prime mover power can also be shown on the
diagram (Fig. 12.34).
SHORT-TIME OPERATION AND SERVICE FACTOR
The heating of the armature and field windings of a synchronous generator is the most
important limit in steady-state operation. The power level at which the heating limit usually
occurs is much lower than the maximum power that the generator is mechanically and
FIGURE 12.33 The resulting generator capability curve.
Downloaded from Digital Engineering Library @ McGraw-Hill (www.digitalengineeringlibrary.com)
Copyright © 2004 The McGraw-Hill Companies. All rights reserved.
Any use is subject to the Terms of Use as given at the website.