
Page 195 -
P. 195
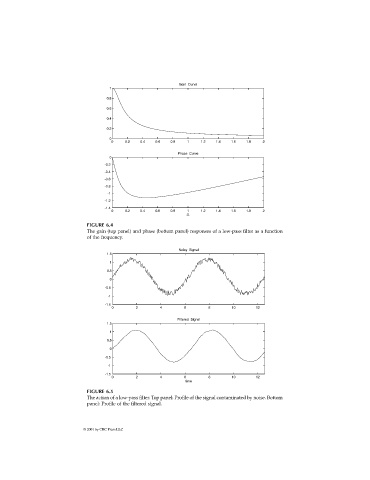
FIGURE 6.4
                              The gain (top panel) and phase (bottom panel) responses of a low-pass filter as a function
                              of the frequency.


                              FIGURE 6.5
                              The action of a low-pass filter. Top panel: Profile of the signal contaminated by noise. Bottom
                              panel: Profile of the filtered signal.


                             © 2001 by CRC Press LLC