
Page 199 -
P. 199
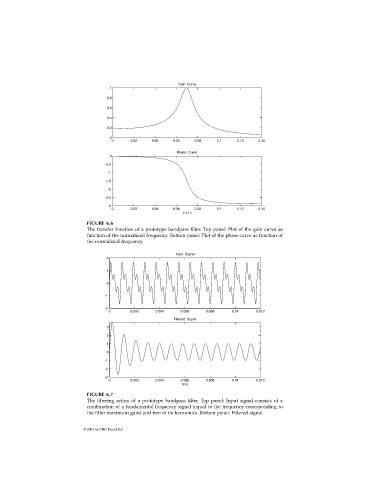
FIGURE 6.6
                              The transfer function of a prototype bandpass filter. Top panel: Plot of the gain curve as
                              function of the normalized frequency. Bottom panel: Plot of the phase curve as function of
                              the normalized frequency.


                              FIGURE 6.7
                              The filtering action of a prototype bandpass filter. Top panel: Input signal consists of a
                              combination of a fundamental frequency signal (equal to the frequency corresponding to
                              the filter maximum gain) and two of its harmonics. Bottom panel: Filtered signal.

                             © 2001 by CRC Press LLC