Page 255 - Elements of Chemical Reaction Engineering 3rd Edition
P. 255

Sec. 5.1   Batch Reactor Data,                                  227

                                Polynomial Fit.   Another technique to differentiate the data is to first  fit the
                                concentration-time data to an nth-order polynomial:

                                                    C,  = a. + a,t + a,t2 + ... f- a,tn       (5-1 1)

                                 Many personal computer software packages contain programs that will  calcu-
                                 late tlhe  best values for the constants  ai. One has only to enter th., concentra-
                                                                                         n
                                 tion-time data and choose the order of  the polynomial. After determining the
                                 constants, ai, one has only to differentiate Equation (5-11) with respect to time:


                                                                                              (5-12)

                                 Thus  concentration  and  the  time  rate  of  change  of  concentration  are  both
                                 known at any time t.
                                      Care must be taken in choosing the order of  the polynomial. If  the order
                                 is too low, the ]polynomial fit will not capture the trends in the data and not go
                                 through many of the points. If too large an order is chosen, the fitted curve can
                                 have peaks and  valleys as it goes through most all of  the data points, thereby
                                 producing signjficant errors when the derivatives, dCA/dt, are generated iit the
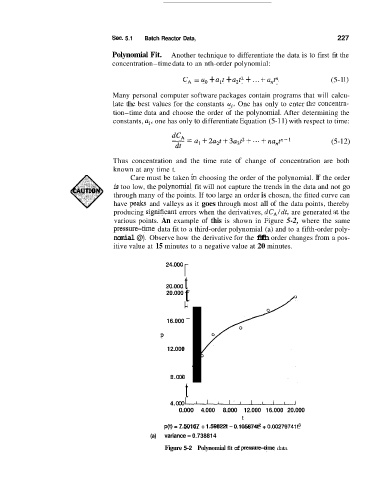
                                 various points. An  example of  this  is  shown  in  Figure 5-2, where  the  same
                                 pressuretime data fit to a third-order polynomial (a) and to a fifth-order poly-
                                 nomial @).  Observe how the derivative for the fifth order changes from a pos-
                                 itive value at 15 minutes to a negative value at 20 minutes.


                                                     t

                                                     -
                                                     I
                                                20.000
                                                20.000  t                         P
                                                     L  -
                                                16.000  -
                                                16.000
                                              P  P
                                                12.000


                                                 8.000
                                                     t

                                                 4.000 3
                                                   0.000  4.000   8.000  12.000  16.000  20.000
                                                                     t
                                               p(t) = 7.50167 + 1.59822t - 0.1056746 + 0.00279741@
                                           (a)   variance = 0.738814
                                               Figure 5-2  Polynomial fit of pressuretime data.
   250   251   252   253   254   255   256   257   258   259   260