
Page 259 - Elements of Chemical Reaction Engineering 3rd Edition
P. 259
Sec. 5.1 Batch Reactor Data 23 1
Mole balance Taking the natural logarithm of both sides gives us
in terms of the
measured
variable, P (E,5-1.6)
I I
Observe that the reaction order, (Y, can be determined from the slope of a plot of
InldPIdt) versus ln(3Po- P). Once (Y is known, the constant k' may be calculated
from the ratio
(E5- 1.7)
at any point.
3. Look for simpl%kations. We have assumed the reaction is irreversible.
Check to see if any terms in the equation can be neglected [e.g., the term EX in
(1 -1 EX) when (EX< 111.
4. Determine dPIcit from the pressure-time data and then the reaction order a.
The data are reported in terms of total pressure as a function of time; consequenrly,
dP
First find ;i; we must differentiate the data either numerically or graphically before we can use
Equations (E5-1.6) and (E5- 1.7) to evaluate the reaction order and specific reaction
rate. First we shall evaluate dPldt by graphical differentiation. Many prefer the
graphical analysis because they use it to visualize the discrepancies in their data.
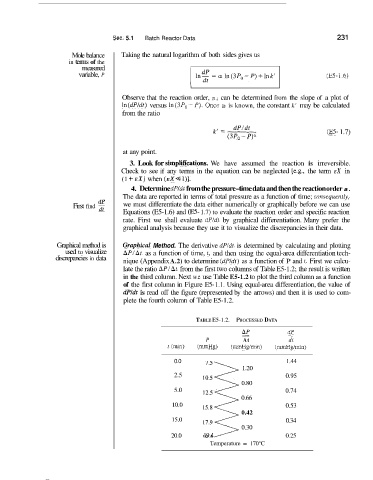
Graphical method is GraphicaE Method. The derivative dPldt is determined by calculating and plotting
used to visualize AP/At as a function of time, r, and then using the equal-area differentiation tech-
discrepancies in data nique (Appendix A.2) to determine (dPldr) as a function of P and r, First we calcu-
late the ratio NPIAi from the first two columns of Table E5-1.2; the result is written
in the third column. Next we use Table E5-1.2 to plot the third column as a function
of the first column in Figure E5- 1.1. Using equal-area differentiation, the value of
dP/,dt is read off the figure (represented by the arrows) and then it is used to com-
plete the fourth column of Table E5-1.2.
TABLE E5-1.2. PROCESSED DATA
AP dP
-
-
dt
At
P
20.0 3
t (min) (mmHg) (mmHg/min) (mmHg/min)
0.0
1.44
1.20
2.5
0.95
0.80
5.0
0.74
0.66
10.0
0.53
15.8
0.42
15.0
17.9
0.30
19.4
0.25
Temperature = 170°C 0.34