
Page 262 - Elements of Chemical Reaction Engineering 3rd Edition
P. 262
234 Collection and Analysis of Rate Data Chap. 5
2.0
1.5
1 .0
0.9
-
0.8
0.7
0.6
0.5
E - 0.4
$15
0.3
0.2
I
0.1
1 .o 2 3 4 5 6 7 8910 15 20
[3P0 - PI (mm Hg)
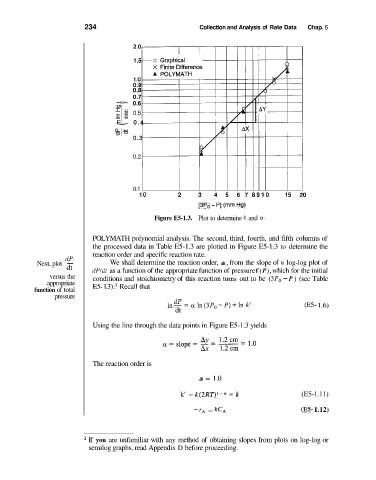
Figure E5-1.3. Plot to determine k and a.
POLYMATH polynomial analysis. The second, third, fourth, and fifth columns of
the processed data in Table E5-1.3 are plotted in Figure E5-1.3 to determine the
reaction order and specific reaction rate.
dP
Next, plot - We shall determine the reaction order, a, from the slope of a log-log plot of
dt dPldt as a function of the appropriate function of pressure f (P), which for the initial
versus the conditions and stoichiometry of this reaction turns out to be ( 3P0 - P) (see Table
appropriate E5- 1 .3).3 Recall that
function of total
pressure dP
In- =,aln(3Po-P)+lnk' (E5- 1.6)
dt
Using the line through the data points in Figure E5-1.3 yields
The reaction order is
a = 1.0
k' = k(2RT)'-" = k (E5-1.11)
-r, = kC, (E5- 1.12)
If you are unfamiliar with any method of obtaining slopes from plots on log-log or
semilog graphs, read Appendix D before proceeding.