
Page 265 - Elements of Chemical Reaction Engineering 3rd Edition
P. 265
Sec. 5.1 Batch Reactor Data 237
Consequently, we see that the slope of a plot of [In (cA,,/cA)] as a function of
time is linear with slope k.
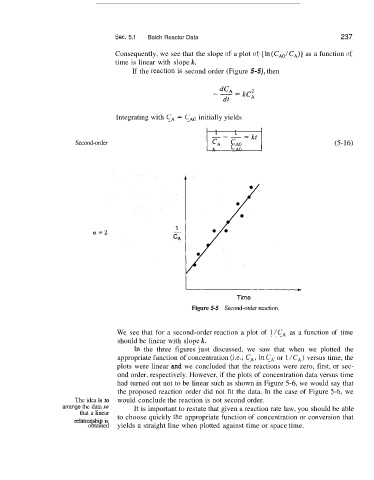
If the re,action is second order (Figure 5-5), then
Integrating with C, = C,, initially yields
i'"l
Second-order 'A 'A0 (5-16)
a=2
Figure 5-5 Second-order reaction.
We see that for a second-order reaction a plot of l/CA as a function of time
should be linear with slope k.
In the three figures just discussed, we saw that when we plotted the
appropriate function of concentration (Le., C,, In C, or l/CA) versus time, the
plots were linear and we concluded that the reactions were zero, first, or sec-
ond order, respectively. However, if the plots of concentration data versus time
had turned out not to be linear such as shown in Figure 5-6, we would say that
the proposed reaction order did not fit the data. In the case of Figure 5-6, we
The idea is to would conclude the reaction is not second order.
arrange the data so It is important to restate that given a reaction rate law, you should be able
that a linear
relationship is to choose quickly the appropriate function of concentration or conversion that
obtained yields a straight line when plotted against time or space time.