
Page 267 - Elements of Chemical Reaction Engineering 3rd Edition
P. 267
Sec. 5.2 Method of Initial Rates 239
28.8
10
9
8
7
6
5
2.5
2
1.5
/’I 1
1
5 10 15 20 25 30
t (rnin)
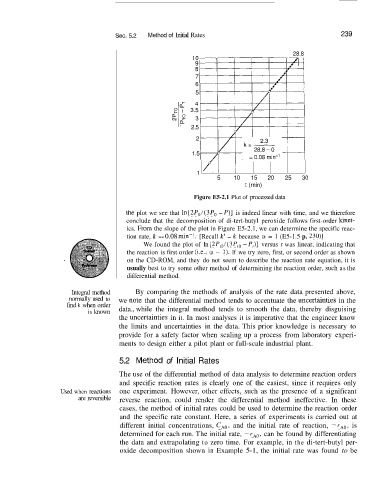
Figure E5-2.1 Plot of processed data
thle plot we see that In [2P0/(3P0 - P)] is indeed linear with time, and we thierefore
conclude that the decomposition of di-tert-butyl peroxide follows first-order kinet-
ics. From the slope of the plot in Figure E5-2.1, we can determine the specific reac-
tion rate, k == 0.08 min--l. [Recall k’ = k because (Y = 1 (E5-1.5 p. 23O)J
We found the plot of In [2P,,l(3P,, - Pi)] versus t was linear, indicating that
the reaction is first order (i.e., a = 1). If we try zero, first, or second order as shown
on the CD-ROM, and they do not seem to describe the reaction rate equation, it is
usually best to try some other method of determining the reaction order, such as the
differential method.
Integral method By comparing the methods of analysis of the rate data presented above,
normally used to we note that the differential method tends to accentuate the uncertaintie& in the
find k when order
is known data., while the integral method tends to smooth the data, thereby disguising
the uncertainties in it. In most analyses it is imperative that the engineer know
the limits and uncertainties in the data. This prior knowledge is necessary to
provide for a safety factor when scaling up a process from laboratory experi-
ments to design either a pilot plant or full-scale industrial plant.
5.2 Method of Initial Rates
The use of the differential method of data analysis to determine reaction orders
and specific reaction rates is clearly one of the easiest, since it requires only
Used when reactions one experiment. However, other effects, such as the presence of a significant
are reversible reverse reaction, could render the differential method ineffective. In these
cases, the method of initial rates could be used to determine the reaction order
and the specific rate constant. Here, a series of experiments is carried out at
different initial concentrations, C,,, and the initial rate of reaction, -rAO, is
determined for each run. The initial rate, -rAO, can be found by differentiating
the data and extrapolating to zero time. For example, in the di-tert-butyl per-
oxide decomposition shown in Example 5-1, the initial rate was found to be