Page 266 - Elements of Chemical Reaction Engineering 3rd Edition
P. 266

238                            Collection and Analysis of Rate Data   Chap. 5


                    af2


                                                           time
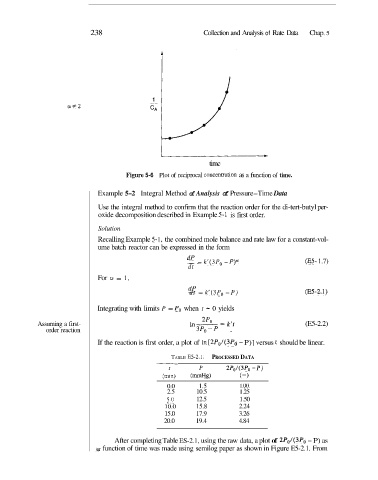
                                    Figure 5-6  Plot of reciprocal concentfation as a function of  time.

                            Example 5-2  Integral Method of Analysis of Pressure-Time Data
                            Use the integral method to confirm that the reaction order for the di-tert-butyl per-
                            oxide decomposition described in Example 5-1 is first order.

                            Solution
                            Recalling Example 5-1, the combined mole balance and rate law for a constant-vol-
                            ume batch reactor can be expressed in the form
                                                     dP -- - k'(3P0 - P)"            (E5- 1.7)
                                                     dt
                            For  a = 1,
                                                     -_
                                                     dP - k'(3P0 - P)                (E5-2.1)
                                                     dt
                            Integrating with limits P  = Po when  t = 0 yields

           Assuming a first-                                                         (E5-2.2)
              order reaction
                            If the reaction is first order, a plot of  In [2P0/(3P0 - P)] versus t should be linear.
                                            -
                                                TABLE E5-2.1.  PROCESSED DATA
                                                t       P       2P01(3P0 - P)
                                              (min)   (mmHg)       (-)
                                               0.0      1.5        1 .oo
                                               2.5     10.5        1.25
                                               50      12.5        1.50
                                              10.0     15.8        2.24
                                              15.0     17.9        3.26
                                              20.0     19.4        4.84

                                 After completing Table ES-2.1, using the raw data, a plot of  2P,/(3P0 - P) as
                            \a function of time was made using semilog paper as shown in Figure E5-2.1. From
   261   262   263   264   265   266   267   268   269   270   271