
Page 256 - Elements of Chemical Reaction Engineering 3rd Edition
P. 256
Collection and Analysis of Rate Data Chap. 5
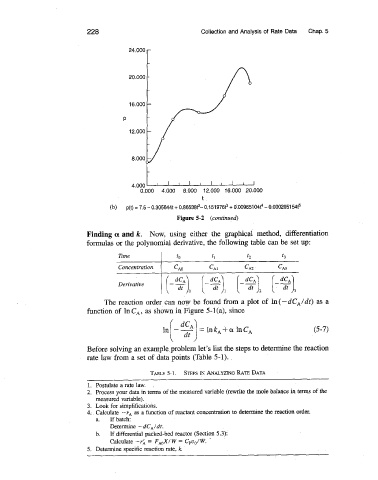
Figure 5-2 (continued)
Finding a and k. Now, using either the graphical method, differentiation
formulas or the polynomial derivative, the following table can be set up:
Time to ti t2 t3
Concentration c~o CAI CAZ 'A,
Derivative I (%)fl (2) (-21
The reaction order can now be found from a plot of In(-dC,/dt) as a
function of InC,, as shown in Figure 5-l(a), since
Before solving an example problem let's list the steps to determine the reaction
rate law from a set of data points (Table 5-1). .
TABLE 5-1. STEPS IN ANALYZING RATE DATA
1. Postulate a rate law.
2. Process your data in terms of the measured variable (rewrite the mole balance in terms of the
measured variable).
3. Look for simplifications.
4. Calculate -rA as a function of reactant concentration to determine the reaction order.
a. If batch:
Determine -dCA/dt.
b. If differential packed-bed reactor (Section 5.3):
Calculate -rA = FAOX/ W = Cpv0/W.
5. Determine specific reaction rate, k.