
Page 450 - Elements of Chemical Reaction Engineering Ebook
P. 450
Chap. 7 Questions and Problems 42 1
reduces the flow (i.e., damages the formation and reduces permeability).
When the bacteria are fed fructose or glucose, there is no damage to the
porous medium. [R. Lappan and H. S. Fogler, SPE Prod. Eng., 7(2), 167-171
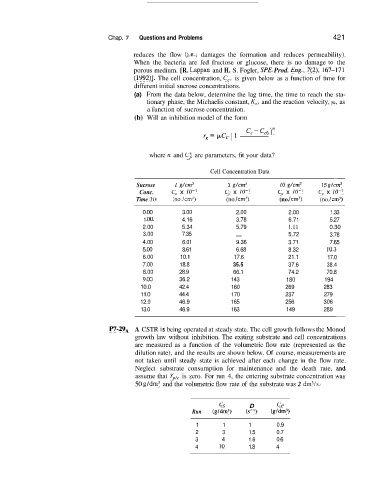
(1992)l. The cell concentration, C,, is given below as a function of time for
different initial sucrose concentrations.
(a) From the data below, determine the lag time, the time to reach the sta-
tionary phase, the Michaelis constant, K,, and the reaction velocity, EL, as
a function of sucrose concentration.
(b) Will an inhibition model of the form
where n and C; are parameters, fit your data?
Cell Concentration Data
-
Sucrose 1 g/crn’ 5 g/crn3 10 g/cm3 15 g/cm3
Conc. c, x 10-7 c, x 10-7 c, x 10-7 c, x 10-7
Time (h) (no./cm3) (no. /cm3) (no. /cm3) (no. / cm3)
0.00 3.00 2.00 2.00 1.33
1 .oo. 4.16 3.78 6.71 5.27
2.00 5.34 5.79 1.11 0.30
3.00 7.35 - 5.72 3.78
4.00 6.01 9.36 3.71 7.65
5.00 8.61 6.68 8.32 10.3
6.00 10.1 17.6 21.1 17.0
7.00 18.8 35.5 37.6 38.4
8.00 28.9 66.1 74.2 70.8
9 .OO 36.2 143 180 194
10.0 42.4 160 269 283
11.0 44.4 170 237 279
12.0 46.9 165 256 306
13.0 46.9 163 149 289
-
P7-29* A CSTR is being operated at steady state. The cell growth follows the Monod
growth law without inhibition. The exiting substrate and cell concentrations
are measured as a function of the volumetric flow rate (represented as the
dilution rate), and the results are shown below. Of course, measurements are
not taken until steady state is achieved after each change in the flow rate.
Neglect substrate consumption for maintenance and the death rate, and
assume that Yplc is zero. For run 4, the entering substrate concentration was
50 g/dm3 and the volumetric flow rate of the substrate was 2 dm3/s.
CS D CC
Run (gldm’) (SKI) (gldm3)
1 1 1 0.9
2 3 1.5 0.7
3 4 1.6 0.6
4 10 1.8 4