
Page 524 - Elements of Chemical Reaction Engineering Ebook
P. 524
494 Steady-State Nonisothermal Reactor Design Chap. 8
Heat-generated
curves, G(T)
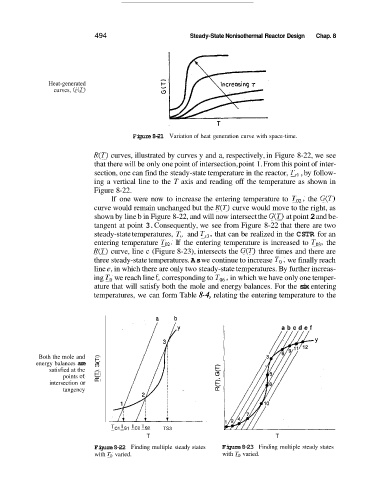
Figure 8-21 Variation of heat generation curve with space-time.
R(T) curves, illustrated by curves y and a, respectively, in Figure 8-22, we see
that there will be only one point of intersection, point 1. From this point of inter-
section, one can find the steady-state temperature in the reactor, T,, , by follow-
ing a vertical line to the T axis and reading off the temperature as shown in
Figure 8-22.
If one were now to increase the entering temperature to TO,, the G(T)
curve would remain unchanged but the R(T) curve would move to the right, as
shown by line b in Figure 8-22, and will now intersect the G(T) at point 2 and be-
tangent at point 3. Consequently, we see from Figure 8-22 that there are two
steady-state temperatures, T,, and Ts3, that can be realized in the CSTR for an
entering temperature To2. If the entering temperature is increased to To3, the
R(T) curve, line c (Figure 8-23), intersects the G(T) three times and there are
three steady-state temperatures. As we continue to increase TO, we finally reach
line e, in which there are only two steady-state temperatures. By further increas-
ing To we reach line f, corresponding to To,, in which we have only one temper-
ature that will satisfy both the mole and energy balances. For the six entering
temperatures, we can form Table 8-4, relating the entering temperature to the
abcdef
Both the mole and -
energy balances are
points of k
satisfied at the r;
intersection or
tangency
TCl Tsr TC2 TS2 TS3
T T
Figure 8-22 Finding multiple steady states Figure 8-23 Finding multiple steady states
with To varied. with To varied.