
Page 525 - Elements of Chemical Reaction Engineering Ebook
P. 525
Sec. 8.6, Multiple Steady States 495
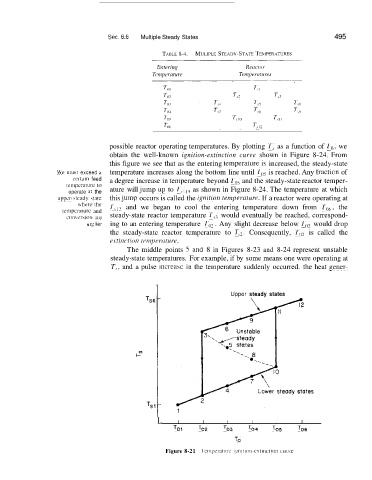
possible reactor operating temperatures. By plotting T,, as a function of To, we
obtain the well-known ignition-extinction curve shown in Figure 8-24. From
this figure we see that as the entering temperature'is increased, the steady-state
we lllllit exceed ;I temperature increases along the bottom line until T,, is reached. Any fractio'n of
cert;iin feed a degree increase in temperature beyond To, and the steady-state reactor temper-
tcnq~er~ltLlre to ature will jump up to T,, I, as shown in Figure 8-24. The temperature at which
operate at the
tipper hteady \tate this jump occurs is called the ignifioii tenipernture. If a reactor were operating at
uhci-e the T,,, and we began to cool the entering temperature down from To,, the
rel~lpel.a!lll-e and steady- state reactor temperature T,, would eventually be reached, correspond-
coiiver.;ion ;ire
ti I 2 lie r ing to an entering temperature To?. Any slight decrease below To, would drop
the steady-state reactor temperature to Til. Consequently, To, is called the
ei-tiiictioii teiiij~e,r-citurr.
The middle points 5 and 8 in Figures 8-23 and 8-24 represent unstable
steady-state temperatures. For example, if by some means one were operating at
T,, and a pulse iincrease in the temperature suddenly occurred. the heat gener-
Upper steady states
1
L I I 1 I 1 I
T02 T03 T04 T05 T06
TO
Figure 8-21 Teiiipmiturr i~tiitioii-c'xtinciion ctii-vc