Page 56 - Elements of Chemical Reaction Engineering Ebook
P. 56

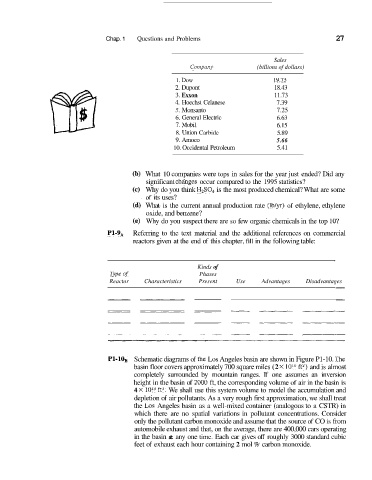
Chap. 1   Questions and Problems                                27


                                                                              Sales
                                                      Company            (billions of dollars)
                                                  1. Dow                      19,73
                                                  2. Dupont                   18.43
                                                  3. Exxon                    11.73
                                                  4. Hoechst Celanese         7.39
                                                  5. Monsanto                 7.25
                                                  6. General Electric         6.63
                                                  7. Mobil                    6.15
                                                  8. Union Carbide            5.89
                                                  9. Amoco                    5.66
                                                 10. Occidental Petroleum     5.41


                                          What  10 companies were tops in sales for the year just ended? Did any
                                          significant chinges occur compared to the 1995 statistics?
                                          Why do you think H2S04 is the most produced chemical? What are some
                                          of its uses?
                                          What-  is the current annual production rate (lb/yr) of  ethylene, ethylene
                                          oxide, and benzene?
                                          Why do you suspect there are so few organic chemicals in the top lo?
                               P1-9*  Referring to  the text  material and the  additional references on  commercial
                                      reactors given at the end of  this chapter, fill in the following table:


                                                                                              /.-
                                                        Kinds of
                                Type of                  Phases
                                Reactor   Characteristics   Present   Use   Advantages   Disadvantages
                                                                                               -
                               - -___                                                          -


                               P1-10,  Schematic diagrams of the Los Angeles basin are shown in Figure P1-10. The
                                      basin floor covers approximately 700 square miles (2 X 10lo ft2) and is almost
                                      completely  surrounded by  mountain  ranges.  If  one  assumes  an  inversion
                                      height in the basin of 2000 ft, the corresponding volume of air in the basin is
                                       4 X IOi3 ft3. We shall use this system volume to model the accumulation and
                                      depletion of air pollutants. As a very rough first approximation, we shall treat
                                      the Los Angeles basin as a well-mixed container (analogous to a CSTR) in
                                      which  there  are  no  spatial  variations in  pollutant  concentrations. Consider
                                       only the pollutant carbon monoxide and assume that the source of CO is from
                                       automobile exhaust and that, on the average, there are 400,000 cars operating
                                      in the basin at any one time. Each car gives off  roughly 3000 standard cubic
                                      feet of exhaust each hour containing 2 mol % carbon monoxide.
   51   52   53   54   55   56   57   58   59   60   61