
Page 70 - Elements of Chemical Reaction Engineering Ebook
P. 70
Sec, 2.3 Applications of the Design Equations for. Continuous-Flow Reactors 41
each of the concentrations can be expressed as a function of the conversion X
(see Chapter 3); consequently, -rA can be expressed as a function of X.
Ii particularly simple functional dependence, yet one that occurs on
many occasions, is -rA = kCAo(1 - X). For this dependence, a plot of the
reciprocal rate of reaction (-l/rA) as a function of conversion yields a curve
similar to the one shown in Figure 2- 1 I where
To illustrate the design of a series of reactors, we consider the isothermal
gas-phase decomposition reaction
A __j B+C
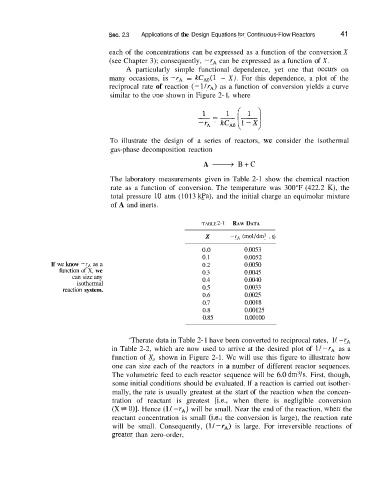
The laboratory measurements given in Table 2-1 show the chemical reaction
rate as a function of conversion. The temperature was 300°F (422.2 K), the
total pressure 10 atm (1013 kPa), and the initial charge an equimolar mixture
of A and inerts.
‘TABLE 2-1 RAW DATA
X -rA (mol/dm3 . s)
0.0 0.0053
0.1 0.0052
If we know -rA as a 0.2 0.0050
function of X, we 0.3 0.0045
can size any 0.4 0.0040
isothermal
reaction system. 0.5 0.0033
0.6 0.0025
0.7 0.0018
0.8 0.00125
0.85 0.00100
‘The rate data in Table 2- 1 have been converted to reciprocal rates, 1 I - rA
in Table 2-2, which are now used to arrive at the desired plot of ll-rA as a
function of X, shown in Figure 2-1. We will use this figure to illustrate how
one can size each of the reactors in a number of different reactor sequences.
The volumetric feed to each reactor sequence will be 6.0 dm3/s. First, though,
some initial conditions should be evaluated. If a reaction is carried out isother-
mally, the rate is usually greatest at the start of the reaction when the concen-
tration of reactant is greatest [i.e., when there is negligible conversion
(X zz O)]. Hence (1 / - rA) will be small. Near the end of the reaction, when the
reactant concentration is small (i.e., the conversion is large), the reaction rate
will be small. Consequently, (l/-rA) is large. For irreversible reactions of
greater than zero-order,