
Page 683 - Encyclopedia of Business and Finance
P. 683
eobf_S 7/5/06 3:21 PM Page 660
Service Industries
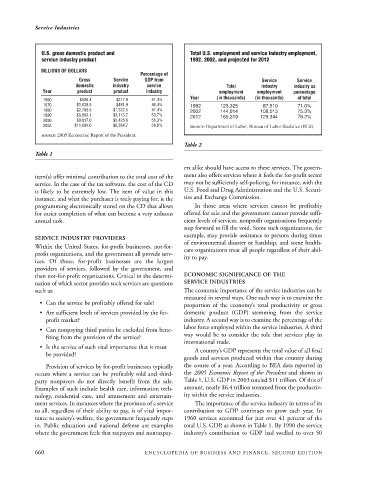
U.S. gross domestic product and Total U.S. employment and service industry employment,
service industry product 1992, 2002, and projected for 2012
BILLIONS OF DOLLARS
Percentage of
Gross Service GDP from Service Service
domestic industry service Total industry industry as
Year product product industry employment employment percentage
1960 $526.4 $217.9 41.4% Year (in thousands) (in thousands) of total
1970 $1,038.5 $481.9 46.4% 1992 123,325 87,510 71.0%
1980 $2,789.5 $1,322.5 47.4% 2002 144,014 108,513 75.3%
1990 $5,803.1 $3,113.7 53.7% 2012 165,319 129,344 78.2%
2000 $9,817.0 $5,425.6 55.3%
2003 $11,004.0 $6,384.7 58.0% SOURCE: Department of Labor, Bureau of Labor Statistics (BLS).
SOURCE: 2005 Ecomomic Report of the President.
Table 2
Table 1
ers alike should have access to these services. The govern-
item(s) offer minimal contribution to the total cost of the ment also offers services where it feels the for-profit sector
service. In the case of the tax software, the cost of the CD may not be sufficiently self-policing, for instance, with the
is likely to be extremely low. The item of value in this U.S. Food and Drug Administration and the U.S. Securi-
instance, and what the purchaser is truly paying for, is the ties and Exchange Commission.
programming electronically stored on the CD that allows In those areas where services cannot be profitably
for easier completion of what can become a very arduous offered for sale and the government cannot provide suffi-
annual task. cient levels of services, nonprofit organizations frequently
step forward to fill the void. Some such organizations, for
example, may provide assistance to persons during times
SERVICE INDUSTRY PROVIDERS
of environmental disaster or hardship, and some health-
Within the United States, for-profit businesses, not-for- care organizations treat all people regardless of their abil-
profit organizations, and the government all provide serv- ity to pay.
ices. Of these, for-profit businesses are the largest
providers of services, followed by the government, and
then not-for-profit organizations. Critical in the determi- ECONOMIC SIGNIFICANCE OF THE
nation of which sector provides such services are questions SERVICE INDUSTRIES
such as: The economic importance of the service industries can be
measured in several ways. One such way is to examine the
• Can the service be profitably offered for sale? proportion of the economy’s total productivity or gross
• Are sufficient levels of services provided by the for- domestic product (GDP) stemming from the service
profit market? industry. A second way is to examine the percentage of the
labor force employed within the service industries. A third
• Can nonpaying third parties be excluded from bene-
way would be to consider the role that services play in
fiting from the provision of the service?
international trade.
• Is the service of such vital importance that it must A country’s GDP represents the total value of all final
be provided?
goods and services produced within that country during
Provision of services by for-profit businesses typically the course of a year. According to BEA data reported in
occurs where a service can be profitably sold and third- the 2005 Economic Report of the President and shown in
party nonpayers do not directly benefit from the sale. Table 1, U.S. GDP in 2003 totaled $11 trillion. Of this of
Examples of such include health care, information tech- amount, nearly $6.4 trillion stemmed from the productiv-
nology, residential care, and amusement and entertain- ity within the service industries.
ment services. In instances where the provision of a service The importance of the service industry in terms of its
to all, regardless of their ability to pay, is of vital impor- contribution to GDP continues to grow each year. In
tance to society’s welfare, the government frequently steps 1960 services accounted for just over 41 percent of the
in. Public education and national defense are examples total U.S. GDP, as shown in Table 1. By 1990 the service
where the government feels that taxpayers and nontaxpay- industry’s contribution to GDP had swelled to over 50
660 ENCYCLOPEDIA OF BUSINESS AND FINANCE, SECOND EDITION