
Page 169 - Academic Press Encyclopedia of Physical Science and Technology 3rd BioTechnology
P. 169
P1: GKY/GLQ/GTK P2: GLM Final Pages
Encyclopedia of Physical Science and Technology en009I-422 July 6, 2001 19:57
Metabolic Engineering 397
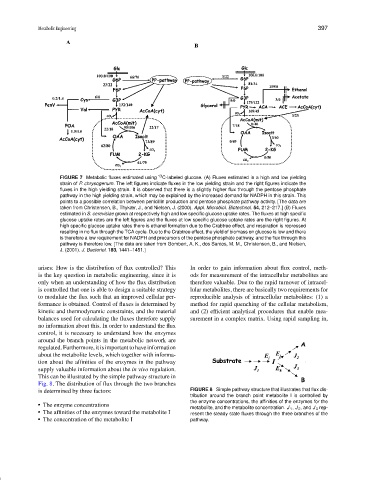
FIGURE 7 Metabolic fluxes estimated using 13 C-labeled glucose. (A) Fluxes estimated in a high and low yielding
strain of P. chrysogenum. The left figures indicate fluxes in the low yielding strain and the right figures indicate the
fluxes in the high yielding strain. It is observed that there is a slightly higher flux through the pentose phosphate
pathway in the high yielding strain, which may be explained by the increased demand for NADPH in this strain. This
points to a possible correlation between penicillin production and pentose phosphate pathway activity. [The data are
taken from Christensen, B., Thykær, J., and Nielsen, J. (2000). Appl. Microbiol. Biotechnol. 54, 212–217.] (B) Fluxes
estimated in S. cerevisiae grown at respectively high and low specific glucose uptake rates. The fluxes at high specific
glucose uptake rates are the left figures and the fluxes at low specific glucose uptake rates are the right figures. At
high specific glucose uptake rates there is ethanol formation due to the Crabtree effect, and respiration is repressed
resulting in no flux through the TCA cycle. Due to the Crabtree effect, the yield of biomass on glucose is low and there
is therefore a low requirement for NADPH and precursors of the pentose phosphate pathway, and the flux through this
pathway is therefore low. [The data are taken from Gombert, A. K., dos Santos, M. M., Christensen, B., and Nielsen,
J. (2001). J. Bacteriol. 183, 1441–1451.]
arises: How is the distribution of flux controlled? This In order to gain information about flux control, meth-
is the key question in metabolic engineering, since it is ods for measurement of the intracellular metabolites are
only when an understanding of how the flux distribution therefore valuable. Due to the rapid turnover of intracel-
is controlled that one is able to design a suitable strategy lular metabolites, there are basically two requirements for
to modulate the flux such that an improved cellular per- reproducible analysis of intracellular metabolites: (1) a
formance is obtained. Control of fluxes is determined by method for rapid quenching of the cellular metabolism,
kinetic and thermodynamic constraints, and the material and (2) efficient analytical procedures that enable mea-
balances used for calculating the fluxes therefore supply surement in a complex matrix. Using rapid sampling in,
no information about this. In order to understand the flux
control, it is necessary to understand how the enzymes
around the branch points in the metabolic network are
regulated. Furthermore, it is important to have information
about the metabolite levels, which together with informa-
tion about the affinities of the enzymes in the pathway
supply valuable information about the in vivo regulation.
This can be illustrated by the simple pathway structure in
Fig. 8. The distribution of flux through the two branches
is determined by three factors: FIGURE 8 Simple pathway structure that illustrates that flux dis-
tribution around the branch point metabolite I is controlled by
the enzyme concentrations, the affinities of the enzymes for the
The enzyme concentrations
metabolite, and the metabolite concentration. J 1 , J 2 , and J 3 rep-
The affinities of the enzymes toward the metabolite I resent the steady state fluxes through the three branches of the
The concentration of the metabolite I pathway.