
Page 247 - Academic Press Encyclopedia of Physical Science and Technology 3rd BioTechnology
P. 247
P1: GLQ/GLE P2: GPB Final Pages
Encyclopedia of Physical Science and Technology EN014J-683 July 30, 2001 20:3
Separation and Purification of Biochemicals 655
TABLE III Suitability of Purification Modes and Important Factors to Consider for Optimization
LC Molecular Purification Sample start Sample end
mode characteristic Main features steps condition condition Important factors
SEC Size Limited resolution Intermediate (+) Limited sample Buffer exchanged Pore size and volume
Low capacity Polishing (+++) volume (<5% c.v.) (if required) Bed height
and flow rate range
Low speed Diluted sample Flow rate
IEC Charge High resolution Capture (+++) Low ionic strength High ionic strength pH
High capacity Intermediate (+++) No volume limitation or pH change Gradient slope
High speed Polishing (+++) Concentrated sample Sample load
AC Biospecific High resolution Capture (+++) Specific binding Specific eluting Immobilization of ligand
sites Medium capacity Intermediate (+++) conditions conditions Association constant
High speed Polishing (++) No volume limitation Concentrated sample Elution conditions (step)
Sample residence time
HIC Hydrophobicity Good resolution Capture (++) High ionic strength Low ionic strength Hydrophobic ligand type
Good capacity Intermediate (+++) No volume limitation Concentrated sample Choice of salt concentration
Good speed Polishing (+) Gradient slope
RPC Lipophilicity High resolution Intermediate (+) Limited sample In organic solvent, Media backbone
Low capacity Polishing (+++) volume (<5% c.v.) risk of loss in Gradient slope of modifier
and flow rate range biological activity
Low speed Sample load
A. Basic Parameters 2. Retention
1. Parameters of the Chromatogram Retention is the basis of chromatographic separation, as it
refers to the fact that the different compounds are retained
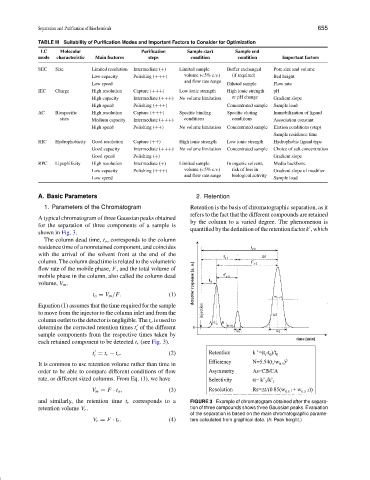
A typical chromatogram of three Gaussian peaks obtained
by the column to a varied degree. The phenomenon is
for the separation of three components of a sample is
quantified by the definition of the retention factor k , which
shown in Fig. 3.
The column dead time, t o , corresponds to the column
residence time of a nonretained component, and coincides
with the arrival of the solvent front at the end of the
column. The column dead time is related to the volumetric
flow rate of the mobile phase, F, and the total volume of
mobile phase in the column, also called the column dead
volume, V m .
t o = V m /F. (1)
Equation (1) assumes that the time required for the sample
to move from the injector to the column inlet and from the
column outlet to the detector is negligible. The t o is used to
determine the corrected retention times t of the different
r
sample components from the respective times taken by
each retained component to be detected t r (see Fig. 3).
t = t r − t o . (2)
r
It is common to use retention volume rather than time in
order to be able to compare different conditions of flow
rate, or different sized columns. From Eq. (1), we have
V m = F · t o , (3)
and similarly, the retention time t r corresponds to a FIGURE 3 Example of chromatogram obtained after the separa-
retention volume V r . tion of three compounds shows three Gaussian peaks. Evaluation
of the separation is based on the main chromatographic parame-
V r = F · t r . (4) ters calculated from graphical data. (h: Peak height.)