
Page 248 - Academic Press Encyclopedia of Physical Science and Technology 3rd BioTechnology
P. 248
P1: GLQ/GLE P2: GPB Final Pages
Encyclopedia of Physical Science and Technology EN014J-683 July 30, 2001 20:3
656 Separation and Purification of Biochemicals
2
is given by the amount of solute (in moles) in the stationary N = 16 · (t r /w) . (10)
phase W s relative to the one in the mobile phase W m .
Determination of w at the baseline is not convenient and
k = W s /W m . (5) often the width at half-height of the peak is used, w 0.5 (see
The retention factor is related to the retention volume of Fig. 3).
the solute V r by N = 5.54 · (t r /w 0.5 ) . (11)
2
k = (V r − V m )/V m . (6) Another relationship for N, which is used with many mod-
ern data processing systems, is
The retention factor can also be expressed in regard to
2
2
time instead of volume (see Fig. 3). The concept of re- N = t · h · 2π/A , (12)
2
r
tention factors was developed for isocratic (from Greek
iso = the same and cratos = strength) elution, i.e., under in which h represents the peak height and A its area. The
conditions where the composition of the mobile phase aim of optimizing a chromatographic separation is to have
does not change throughout the separation. In the case of a column with the highest possible efficiency, meaning the
gradient elution, simple retention times or volumes are highest possible number of plates per meter.
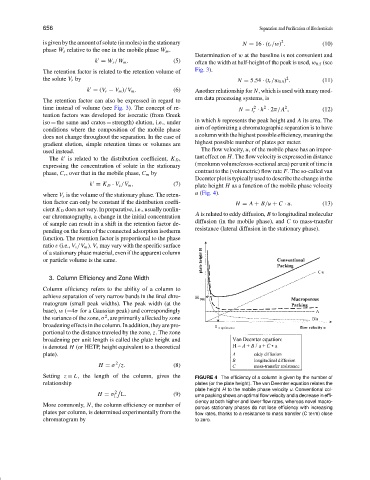
used instead. The flow velocity, u, of the mobile phase has an impor-
The k is related to the distribution coefficient, K D , tant effect on H. The flow velocity is expressed in distance
expressing the concentration of solute in the stationary (=column volume/cross-sectional area) per unit of time in
phase, C s , over that in the mobile phase, C m by contrast to the (volumetric) flow rate F. The so-called van
Deemter plot is typically used to describe the change in the
k = K D · V s /V m , (7) plate height H as a function of the mobile phase velocity
u (Fig. 4).
where V s is the volume of the stationary phase. The reten-
tion factor can only be constant if the distribution coeffi- H = A + B/u + C · u. (13)
cient K D does not vary. In preparative, i.e., usually nonlin-
A is related to eddy diffusion, B to longitudinal molecular
ear chromatography, a change in the initial concentration
diffusion (in the mobile phase), and C to mass-transfer
of sample can result in a shift in the retention factor de-
resistance (lateral diffusion in the stationary phase).
pending on the form of the connected adsorption isotherm
function. The retention factor is proportional to the phase
ratio ε (i.e., V s /V m ). V s may vary with the specific surface
of a stationary phase material, even if the apparent column
or particle volume is the same.
3. Column Efficiency and Zone Width
Column efficiency refers to the ability of a column to
achieve separation of very narrow bands in the final chro-
matogram (small peak widths). The peak width (at the
base), w (=4σ for a Gaussian peak) and correspondingly
2
the variance of the zone, σ , are primarily affected by zone
broadening effects in the column. In addition, they are pro-
portional to the distance traveled by the zone, z. The zone
broadening per unit length is called the plate height and
is denoted H (or HETP, height equivalent to a theoretical
plate).
2
H = σ /z. (8)
Setting z = L, the length of the column, gives the FIGURE 4 The efficiency of a column is given by the number of
relationship plates (or the plate height). The van Deemter equation relates the
plate height H to the mobile phase velocity u. Conventional col-
2
H = σ L. (9)
L umn packing shows an optimal flow velocity and a decrease in effi-
ciency at both higher and lower flow rates, whereas novel macro-
More commonly, N, the column efficiency or number of
porous stationary phases do not lose efficiency with increasing
plates per column, is determined experimentally from the flow rates, thanks to a resistance to mass transfer (C term) close
chromatogram by to zero.