
Page 86 - Academic Press Encyclopedia of Physical Science and Technology 3rd BioTechnology
P. 86
P1: GRB Final Pages
Encyclopedia of Physical Science and Technology EN002G-67 May 25, 2001 20:8
268 Bioreactors
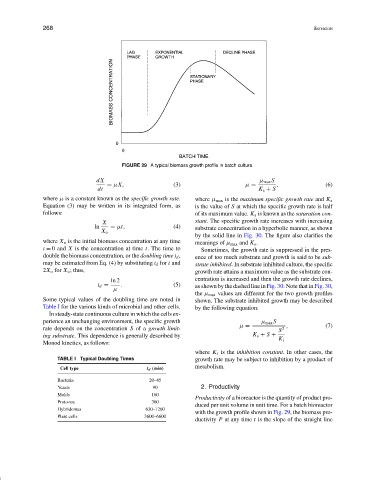
FIGURE 29 A typical biomass growth profile in batch culture.
dX µ max S
= µX , (3) µ = , (6)
dt K s + S
where µ is a constant known as the specific growth rate. where µ max is the maximum specific growth rate and K s
Equation (3) may be written in its integrated form, as is the value of S at which the specific growth rate is half
follows: of its maximum value. K s is known as the saturation con-
X stant. The specific growth rate increases with increasing
ln = µt , (4) substrate concentration in a hyperbolic manner, as shown
X o
by the solid line in Fig. 30. The figure also clarifies the
where X o is the initial biomass concentration at any time meanings of µ max and K s .
t = 0 and X is the concentration at time t. The time to Sometimes, the growth rate is suppressed in the pres-
double the biomass concentration, or the doubling time t d , ence of too much substrate and growth is said to be sub-
may be estimated from Eq. (4) by substituting t d for t and strate inhibited. In substrate inhibited culture, the specific
2X o for X o ; thus, growth rate attains a maximum value as the substrate con-
ln 2 centration is increased and then the growth rate declines,
t d = . (5) as shown by the dashed line in Fig. 30. Note that in Fig. 30,
µ
the µ max values are different for the two growth profiles
Some typical values of the doubling time are noted in shown. The substrate inhibited growth may be described
Table I for the various kinds of microbial and other cells. by the following equation:
In steady-state continuous culture in which the cells ex-
perience an unchanging environment, the specific growth µ max S
rate depends on the concentration S of a growth limit- µ = S 2 , (7)
ing substrate. This dependence is generally described by K s + S +
K i
Monod kinetics, as follows:
where K i is the inhibition constant. In other cases, the
TABLE I Typical Doubling Times growth rate may be subject to inhibition by a product of
metabolism.
Cell type t d (min)
Bacteria 20–45
Yeasts 90 2. Productivity
Molds 160
Productivity of a bioreactor is the quantity of product pro-
Protozoa 360
duced per unit volume in unit time. For a batch bioreactor
Hybridomas 630–1260
with the growth profile shown in Fig. 29, the biomass pro-
Plant cells 3600–6600
ductivity P at any time t is the slope of the straight line