
Page 107 - Academic Press Encyclopedia of Physical Science and Technology 3rd Chemical Engineering
P. 107
P1: ZBU 2nd Revised Pages
Encyclopedia of Physical Science and Technology EN002G-87 May 19, 2001 20:3
Catalyst Characterization 505
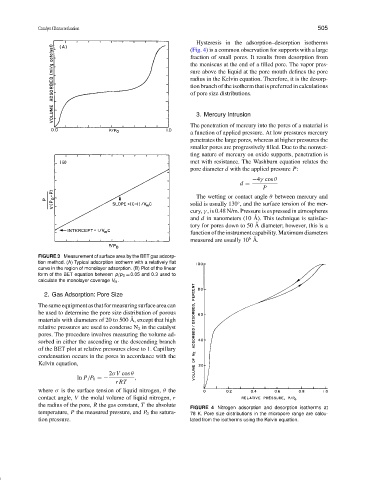
Hysteresis in the adsorption–desorption isotherms
(Fig. 4) is a common observation for supports with a large
fraction of small pores. It results from desorption from
the meniscus at the end of a filled pore. The vapor pres-
sure above the liquid at the pore mouth defines the pore
radius in the Kelvin equation. Therefore, it is the desorp-
tion branch of the isotherm that is preferred in calculations
of pore size distributions.
3. Mercury Intrusion
The penetration of mercury into the pores of a material is
a function of applied pressure. At low pressures mercury
penetrates the large pores, whereas at higher pressures the
smaller pores are progressively filled. Due to the nonwet-
ting nature of mercury on oxide supports, penetration is
met with resistance. The Washburn equation relates the
pore diameter d with the applied pressure P:
−4γ cos θ
d =
P
The wetting or contact angle θ between mercury and
solid is usually 130 , and the surface tension of the mer-
◦
cury, γ , is 0.48 N/m. Pressure is expressed in atmospheres
˚
and d in nanometers (10 A). This technique is satisfac-
˚
tory for pores down to 50 A diameter; however, this is a
function of the instrument capability. Maximum diameters
6 ˚
measured are usually 10 A.
FIGURE 3 Measurement of surface area by the BET gas adsorp-
tion method. (A) Typical adsorption isotherm with a relatively flat
curve in the region of monolayer adsorption. (B) Plot of the linear
form of the BET equation between p/p 0 = 0.05 and 0.3 used to
calculate the monolayer coverage V m .
2. Gas Adsorption: Pore Size
The same equipment as that for measuring surface area can
be used to determine the pore size distribution of porous
˚
materials with diameters of 20 to 500 A, except that high
relative pressures are used to condense N 2 in the catalyst
pores. The procedure involves measuring the volume ad-
sorbed in either the ascending or the descending branch
of the BET plot at relative pressures close to 1. Capillary
condensation occurs in the pores in accordance with the
Kelvin equation,
2σ V cos θ
ln P/P 0 =− ,
rRT
where σ is the surface tension of liquid nitrogen, θ the
contact angle, V the molal volume of liquid nitrogen, r
the radius of the pore, R the gas constant, T the absolute
FIGURE 4 Nitrogen adsorption and desorption isotherms at
temperature, P the measured pressure, and P 0 the satura- 78 K. Pore size distributions in the micropore range are calcu-
tion pressure. lated from the isotherms using the Kelvin equation.