
Page 108 - Academic Press Encyclopedia of Physical Science and Technology 3rd Chemical Engineering
P. 108
P1: ZBU 2nd Revised Pages
Encyclopedia of Physical Science and Technology EN002G-87 May 19, 2001 20:3
506 Catalyst Characterization
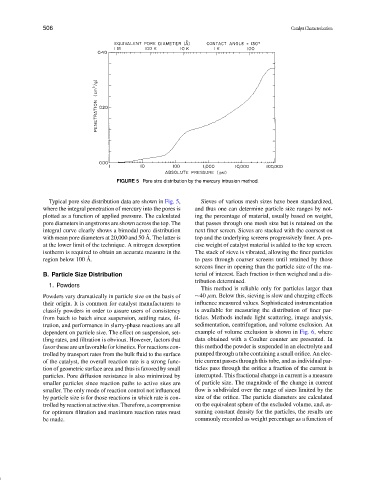
FIGURE 5 Pore size distribution by the mercury intrusion method.
Typical pore size distribution data are shown in Fig. 5, Sieves of various mesh sizes have been standardized,
where the integral penetration of mercury into the pores is and thus one can determine particle size ranges by not-
plotted as a function of applied pressure. The calculated ing the percentage of material, usually based on weight,
pore diameters in angstroms are shown across the top. The that passes through one mesh size but is retained on the
integral curve clearly shows a bimodal pore distribution next finer screen. Sieves are stacked with the coarsest on
˚
with mean pore diameters at 20,000 and 50 A. The latter is top and the underlying screens progressively finer. A pre-
at the lower limit of the technique. A nitrogen desorption cise weight of catalyst material is added to the top screen.
isotherm is required to obtain an accurate measure in the The stack of sieve is vibrated, allowing the finer particles
˚
region below 100 A. to pass through coarser screens until retained by those
screens finer in opening than the particle size of the ma-
B. Particle Size Distribution terial of interest. Each fraction is then weighed and a dis-
tribution determined.
1. Powders
This method is reliable only for particles larger than
Powders vary dramatically in particle size on the basis of ∼40 µm. Below this, sieving is slow and charging effects
their origin. It is common for catalyst manufacturers to influence measured values. Sophisticated instrumentation
classify powders in order to assure users of consistency is available for measuring the distribution of finer par-
from batch to batch since suspension, settling rates, fil- ticles. Methods include light scattering, image analysis,
tration, and performance in slurry-phase reactions are all sedimentation, centrifugation, and volume exclusion. An
dependent on particle size. The effect on suspension, set- example of volume exclusion is shown in Fig. 6, where
tling rates, and filtration is obvious. However, factors that data obtained with a Coulter counter are presented. In
favor these are unfavorable for kinetics. For reactions con- this method the powder is suspended in an electrolyte and
trolled by transport rates from the bulk fluid to the surface pumped through a tube containing a small orifice. An elec-
of the catalyst, the overall reaction rate is a strong func- tric current passes through this tube, and as individual par-
tion of geometric surface area and thus is favored by small ticles pass through the orifice a fraction of the current is
particles. Pore diffusion resistance is also minimized by interrupted. This fractional change in current is a measure
smaller particles since reaction paths to active sites are of particle size. The magnitude of the change in current
smaller. The only mode of reaction control not influenced flow is subdivided over the range of sizes limited by the
by particle size is for those reactions in which rate is con- size of the orifice. The particle diameters are calculated
trolled by reaction at active sites. Therefore, a compromise on the equivalent sphere of the excluded volume, and, as-
for optimum filtration and maximum reaction rates must suming constant density for the particles, the results are
be made. commonly recorded as weight percentage as a function of