
Page 209 - Academic Press Encyclopedia of Physical Science and Technology 3rd Chemical Engineering
P. 209
P1: GAE/LSK P2: FLV Final Pages
Encyclopedia of Physical Science and Technology EN004D-ID159 June 8, 2001 15:47
106 Crystallization Processes
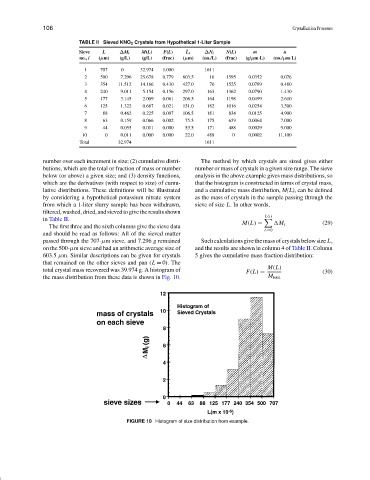
TABLE II Sieved KNO 3 Crystals from Hypothetical 1-Liter Sample
Sieve L ∆M i M(L) F(L) ¯ L i ∆N i N(L) m n
no., i (µm) (g/L) (g/L) (frac) (µm) (no./L) (frac) (g/µm·L) (no./µm·L)
1 707 0 32.974 1.000 1611
2 500 7.296 25.678 0.779 603.5 16 1595 0.0352 0.076
3 354 11.512 14.166 0.430 427.0 70 1525 0.0789 0.480
4 240 9.011 5.154 0.156 297.0 163 1362 0.0790 1.430
5 177 3.145 2.009 0.061 208.5 164 1198 0.0499 2.610
6 125 1.322 0.687 0.021 151.0 182 1016 0.0254 3.500
7 88 0.462 0.225 0.007 106.5 181 834 0.0125 4.900
8 63 0.159 0.066 0.002 75.5 175 659 0.0064 7.000
9 44 0.055 0.011 0.000 53.5 171 488 0.0029 9.000
10 0 0.011 0.000 0.000 22.0 488 0 0.0002 11.100
Total 32.974 1611
number over each increment in size; (2) cumulative distri- The method by which crystals are sized gives either
butions, which are the total or fraction of mass or number number or mass of crystals in a given size range. The sieve
below (or above) a given size; and (3) density functions, analysis in the above example gives mass distributions, so
which are the derivatives (with respect to size) of cumu- that the histogram is constructed in terms of crystal mass,
lative distributions. These definitions will be illustrated and a cumulative mass distribution, M(L), can be defined
by considering a hypothetical potassium nitrate system as the mass of crystals in the sample passing through the
from which a 1-liter slurry sample has been withdrawn, sieve of size L. In other words,
filtered,washed,dried,andsievedtogivetheresultsshown
L(i)
in Table II.
M(L) = M i (29)
The first three and the sixth columns give the sieve data
L=0
and should be read as follows: All of the sieved matter
passed through the 707-µm sieve, and 7.296 g remained Suchcalculationsgivethemassofcrystalsbelowsize L,
on the 500-µm sieve and had an arithmetic average size of and the results are shown in column 4 of Table II. Column
603.5 µm. Similar descriptions can be given for crystals 5 gives the cumulative mass fraction distribution:
that remained on the other sieves and pan (L = 0). The
M(L)
total crystal mass recovered was 39.974 g. A histogram of
F(L) = (30)
the mass distribution from these data is shown in Fig. 10. M total
FIGURE 10 Histogram of size distribution from example.