
Page 245 - Academic Press Encyclopedia of Physical Science and Technology 3rd Chemical Engineering
P. 245
P1: FYK/GJK P2: FJU Final Pages
Encyclopedia of Physical Science and Technology EN005B-205 June 15, 2001 20:24
152 Electrochemical Engineering
C. Secondary Current Distribution
The secondary current distribution is calculated by includ-
ing the effects of the ohmic drop in the electrolyte and the
effects of sluggish electrode kinetics. While the secondary
distribution may be a more realistic approximation, its
calculation is more difficult; therefore, we need to assess
the relative importance of electrode kinetics to determine
whether we can neglect them in a simulation.
Kinetic limitations are manifested by surface overpo-
tential. A plot of surface overpotential on the ordinate
versus current density on the abscissa can be used to de-
termine a so-called polarization resistance. If the slope of
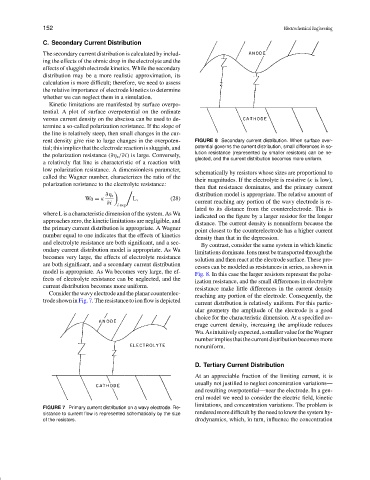
the line is relatively steep, then small changes in the cur-
rent density give rise to large changes in the overpoten- FIGURE 8 Secondary current distribution. When surface over-
tial; this implies that the electrode reaction is sluggish, and potential governs the current distribution, small differences in so-
lution resistance (represented by smaller resistors) can be ne-
the polarization resistance (∂η s /∂i) is large. Conversely,
glected, and the current distribution becomes more uniform.
a relatively flat line is characteristic of a reaction with
low polarization resistance. A dimensionless parameter,
schematically by resistors whose sizes are proportional to
called the Wagner number, characterizes the ratio of the
their magnitudes. If the electrolyte is resistive (κ is low),
polarization resistance to the electrolyte resistance:
then that resistance dominates, and the primary current
∂η s distribution model is appropriate. The relative amount of
Wa = κ L, (28)
∂i i avg current reaching any portion of the wavy electrode is re-
lated to its distance from the counterelectrode. This is
where L is a characteristic dimension of the system. As Wa
indicated on the figure by a larger resistor for the longer
approaches zero, the kinetic limitations are negligible, and
distance. The current density is nonuniform because the
the primary current distribution is appropriate. A Wagner
point closest to the counterelectrode has a higher current
number equal to one indicates that the effects of kinetics
density than that in the depression.
and electrolyte resistance are both significant, and a sec-
By contrast, consider the same system in which kinetic
ondary current distribution model is appropriate. As Wa
limitations dominate. Ions must be transported through the
becomes very large, the effects of electrolyte resistance
solution and then react at the electrode surface. These pro-
are both significant, and a secondary current distribution
cesses can be modeled as resistances in series, as shown in
model is appropriate. As Wa becomes very large, the ef-
Fig. 8. In this case the larger resistors represent the polar-
fects of electrolyte resistance can be neglected, and the
ization resistance, and the small differences in electrolyte
current distribution becomes more uniform.
resistance make little differences in the current density
Consider the wavy electrode and the planar counterelec-
reaching any portion of the electrode. Consequently, the
trode shown in Fig. 7. The resistance to ion flow is depicted
current distribution is relatively uniform. For this partic-
ular geometry the amplitude of the electrode is a good
choice for the characteristic dimension. At a specified av-
erage current density, increasing the amplitude reduces
Wa.Asintuitivelyexpected,asmallervaluefortheWagner
number implies that the current distribution becomes more
nonuniform.
D. Tertiary Current Distribution
At an appreciable fraction of the limiting current, it is
usually not justified to neglect concentration variations—
and resulting overpotential—near the electrode. In a gen-
eral model we need to consider the electric field, kinetic
limitations, and concentration variations. The problem is
FIGURE 7 Primary current distribution on a wavy electrode. Re-
sistance to current flow is represented schematically by the size rendered more difficult by the need to know the system hy-
of the resistors. drodynamics, which, in turn, influence the concentration