
Page 277 - Academic Press Encyclopedia of Physical Science and Technology 3rd Organic Chemistry
P. 277
P1: LDK/GJK P2: GQT/Final Pages
Encyclopedia of Physical Science and Technology EN012G-576 July 28, 2001 12:44
Physical Organic Chemistry 223
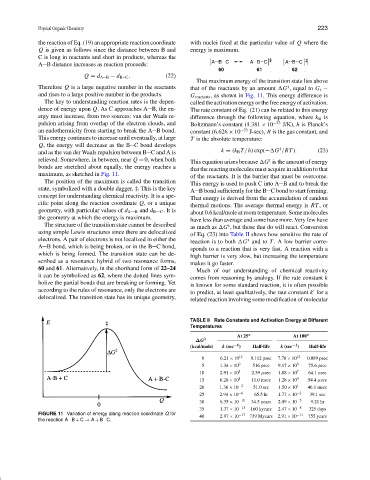
the reaction of Eq. (19) an appropriate reaction coordinate with nuclei fixed at the particular value of Q where the
Q is given as follows since the distance between B and energy is maximum.
C is long in reactants and short in products, whereas the
A B distance increases as reaction proceeds:
Q = d A B − d B C . (22)
That maximum energy of the transition state lies above
Therefore Q is a large negative number in the reactants that of the reactants by an amount G , equal to G ‡ −
‡
and rises to a large positive number in the products. G reactants , as shown in Fig. 11. This energy difference is
The key to understanding reaction rates is the depen- calledtheactivationenergyorthefreeenergyofactivation.
dence of energy upon Q. As C approaches A B, the en- The rate constant of Eq. (21) can be related to this energy
ergy must increase, from two sources: van der Waals re- difference through the following equation, where k B is
pulsion arising from overlap of the electron clouds, and Boltzmann’s constant (1.381 × 10 −23 J/K), h is Planck’s
an endothermicity from starting to break the A B bond. constant (6.626 × 10 −33 J-sec), R is the gas constant, and
This energy continues to increase until eventually, at large T is the absolute temperature:
Q, the energy will decrease as the B C bond develops
‡
and as the van der Waals repulsion between B C and A is k = (k B T/h) exp(− G /RT ). (23)
relieved. Somewhere, in between, near Q = 0, when both ‡
This equation arises because G is the amount of energy
bonds are stretched about equally, the energy reaches a
that the reacting molecules must acquire in addition to that
maximum, as sketched in Fig. 11.
of the reactants. It is the barrier that must be overcome.
The position of the maximum is called the transition
This energy is used to push C into A B and to break the
state, symbolized with a double dagger, ‡. This is the key
A B bond sufficiently for the B C bond to start forming.
concept for understanding chemical reactivity. It is a spe-
That energy is derived from the accumulation of random
cific point along the reaction coordinate Q, or a unique
thermal motions. The average thermal energy is RT ,or
geometry, with particular values of d A B and d B C . It is about 0.6 kcal/mole at room temperature. Some molecules
the geometry at which the energy is maximum.
have less than average and some have more. Very few have
The structure of the transition state cannot be described ‡
as much as G , but those that do will react. Conversion
using simple Lewis structures since there are delocalized
of Eq. (23) into Table II shows how sensitive the rate of
electrons. A pair of electrons is not localized in either the ‡
reaction is to both G and to T . A low barrier corre-
A B bond, which is being broken, or in the B C bond,
sponds to a reaction that is very fast. A reaction with a
which is being formed. The transition state can be de-
high barrier is very slow, but increasing the temperature
scribed as a resonance hybrid of two resonance forms, makes it go faster.
60 and 61. Alternatively, in the shorthand form of 22–24 Much of our understanding of chemical reactivity
it can be symbolized as 62, where the dotted lines sym- comes from reasoning by analogy. If the rate constant k
bolize the partial bonds that are breaking or forming. Yet is known for some standard reaction, it is often possible
according to the rules of resonance, only the electrons are to predict, at least qualitatively, the rate constant k for a
delocalized. The transition state has its unique geometry, related reaction involving some modification of molecular
TABLE II Rate Constants and Activation Energy at Different
Temperatures
At 25 ◦ ◦ At 100 ◦ ◦
∆G ‡ ‡
(kcal/mole) k (sec −1 ) Half-life k (sec −1 ) Half-life
0 6.21 × 10 12 0.112 psec 7.78 × 10 12 0.089 psec
5 1.34 × 10 9 516 psec 9.17 × 10 9 75.6 psec
10 2.91 × 10 5 2.39 µsec 1.08 × 10 7 64.1 nsec
15 6.28 × 10 1 11.0 msec 1.28 × 10 4 54.4 µsec
20 1.36 × 10 −2 51.0 sec 1.50 × 10 1 46.1 msec
25 2.94 × 10 −6 65.5 hr 1.77 × 10 −2 39.1 sec
30 6.35 × 10 −10 34.5 years 2.09 × 10 −5 9.21 hr
35 1.37 × 10 −13 160 kyears 2.47 × 10 −8 325 days
FIGURE 11 Variation of energy along reaction coordinate Q for −17 −11
40 2.97 × 10 739 Myears 2.91 × 10 755 years
the reaction A B + C → A + B C.