
Page 295 - Academic Press Encyclopedia of Physical Science and Technology 3rd Organic Chemistry
P. 295
P1: LDK/GJK P2: GQT/Final Pages
Encyclopedia of Physical Science and Technology EN012G-576 July 28, 2001 12:44
Physical Organic Chemistry 241
VI. QUANTITATIVE RELATIONSHIPS
A. Brønsted Relationship
Much insight has come from recognizing quantitative reg-
ularities among the phenomena of organic chemistry. This
issimplyahighlydevelopedmethodforreasoningbyanal-
ogy. It is especially powerful since it permits the extension
of understanding from one class of reactions to another.
The earliest case was the treatment of reactions subject
to general acid or general base catalysis [Eq. (51), adapted
from Eq. (39)]. The rate constant k HA reflects the speed
with which acid HA can act as a proton donor, and k B
reflects the speed with which base B can act as a proton
acceptor. There ought to be a relationship between the
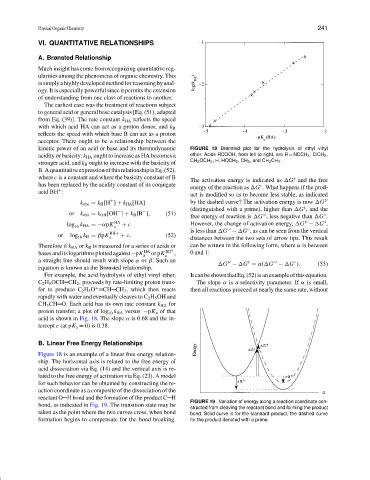
kinetic power of an acid or base and its thermodynamic FIGURE 18 Brønsted plot for the hydrolysis of ethyl vinyl
acidity or basicity: k HA ought to increase as HA becomes a ether. Acids RCOOH, from left to right, are R = NCCH 2 , ClCH 2 ,
CH 3 OCH 2 , H, HOCH 2 ,CH 3 , and CH 3 CH 2 .
stronger acid, and k B ought to increase with the basicity of
B.AquantitativeexpressionofthisrelationshipisEq.(52),
where c is a constant and where the basicity constant of B ‡
The activation energy is indicated as G and the free
has been replaced by the acidity constant of its conjugate ◦
energy of the reaction as G . What happens if the prod-
acid BH :
+
uct is modified so as to become less stable, as indicated
+
k obs = k H [H ] + k HA [HA] by the dashed curve? The activation energy is now G ‡
‡
(distinguished with a prime), higher than G , and the
−
−
or k obs = k OH [OH ] + k B [B ], (51)
◦
◦
free energy of reaction is G , less negative than G .
‡
‡
log k HA = −αpK HA + c However, the change of activation energy, G − G ,
10 a
is less than G − G , as can be seen from the vertical
◦
◦
or log k B = βpK BH+ + c . (52)
10 a distances between the two sets of arrow tips. This result
Therefore if k HA or k B is measured for a series of acids or can be written in the following form, where α is between
bases and its logarithms plotted against −pK HA or pK BH + , 0 and 1:
a a
a straight line should result with slope α or β. Such an ‡
◦
‡
◦
G − G = α( G − G ). (53)
equation is known as the Brønsted relationship.
For example, the acid hydrolysis of ethyl vinyl ether, ItcanbeshownthatEq.(52)isanexampleofthisequation.
C 2 H 5 OCH CH 2 , proceeds by rate-limiting proton trans- The slope α is a selectivity parameter. If α is small,
fer to produce C 2 H 5 O + CH CH 3 , which then reacts then all reactions proceed at nearly the same rate, without
rapidly with water and eventually cleaves to C 2 H 5 OH and
CH 3 CH O. Each acid has its own rate constant k HA for
proton transfer; a plot of log k HA versus −pK a of that
10
acid is shown in Fig. 18. The slope α is 0.68 and the in-
tercept c (at pK a = 0) is 0.38.
B. Linear Free Energy Relationships
Figure 18 is an example of a linear free energy relation-
ship. The horizontal axis is related to the free energy of
acid dissociation via Eq. (14) and the vertical axis is re-
lated to the free energy of activation via Eq. (23). A model
for such behavior can be obtained by constructing the re-
action coordinate as a composite of the dissociation of the
reactant O H bond and the formation of the product C H
FIGURE 19 Variation of energy along a reaction coordinate con-
bond, as indicated in Fig. 19. The transition state may be
structed from cleaving the reactant bond and forming the product
taken as the point where the two curves cross, when bond bond. Solid curve is for the standard product, the dashed curve
formation begins to compensate for the bond breaking. for the product denoted with a prime.