
Page 144 - Academic Press Encyclopedia of Physical Science and Technology 3rd Analytical Chemistry
P. 144
P1: GLM/GJK P2: GRB Final Pages
Encyclopedia of Physical Science and Technology En005H-218 June 15, 2001 20:33
372 Electrophoresis
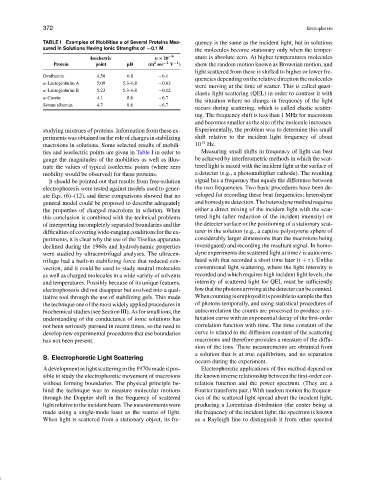
TABLE I Examples of Mobilities u of Several Proteins Mea- quency is the same as the incident light, but in solutions
sured in Solutions Having Ionic Strengths of ∼0.1 M the molecules become stationary only when the temper-
Isoelectric u × 10 −9 ature is absolute zero. At higher temperatures molecules
2
Protein point pH (m sec −1 V −1 ) show the random motion known as Brownian motion, and
light scattered from these is shifted to higher or lower fre-
Ovalbumin 4.58 6.8 −6.1
quencies depending on the relative direction the molecules
α-Lactoglobulin A 5.09 5.3–6.0 −0.63
were moving at the time of scatter. This is called quasi-
α-Lactoglobulin B 5.23 5.3–6.0 −0.12
elastic light scattering (QEL) in order to contrast it with
α-Casein 4.1 8.6 −6.7
the situation where no change in frequency of the light
Serum albumin 4.7 8.6 −6.7
occurs during scattering, which is called elastic scatter-
ing. The frequency shift is less than 1 MHz for macroions
and becomes smaller as the size of the molecule increases.
studying mixtrues of proteins. Information from these ex- Experimentally, the problem was to determine this small
perimentswasobtainedontheroleofchargesinstabilizing shift relative to the incident light frequency of about
macroions in solutions. Some selected results of mobili- 10 15 Hz.
ties and isoelectric points are given in Table I in order to Measuring small shifts in frequency of light can best
gauge the magnitudes of the mobilities as well as illus- be achieved by interferometric methods in which the scat-
trate the values of typical isoelectric points (where zero tered light is mixed with the incident light at the surface of
mobility would be observed) for these proteins. a detecter (e.g., a photomultiplier cathode). The resulting
It should be pointed out that results from free-solution signal has a frequency that equals the difference between
electrophoresis were tested against models used to gener- the two frequencies. Two basic procedures have been de-
ate Eqs. (6)–(12), and these comparisons showed that no veloped for recording these beat frequencies: heterodyne
general model could be proposed to describe adequately and homodyne detection. The heterodyne method requires
the properties of charged macroions in solution. When either a direct mixing of the incident light with the scat-
this conclusion is combined with the technical problems tered light (after reduction of the incident intensity) on
of interpreting incompletely separated boundaries and the the detecter surface or the positioning of a stationary scat-
difficulties of covering wide-ranging conditions for the ex- terer in the solution (e.g., a captive polystyrene sphere of
periments, it is clear why the use of the Tiselius apparatus considerably larger dimensions than the macroions being
declined during the 1960s and hydrodynamic properties investigated) and recording the resultant signal. In homo-
were studied by ultracentrifugal analyses. The ultracen- dyne experiments the scattered light at time t is autocorre-
trifuge had a built-in stabilizing force that reduced con- lated with that recorded a short time later (t + τ). Unlike
vection, and it could be used to study neutral molecules conventional light scattering, where the light intensity is
as well as charged molecules in a wide variety of solvents recorded and which requires high incident light levels, the
and temperatures. Possibly because of its unique features, intensity of scattered light for QEL must be sufficiently
electrophoresis did not disappear but evolved into a qual- lowthatthephotonsarrivingatthedetectercanbecounted.
itative tool through the use of stabilizing gels. This made Whencountingisemployeditispossibletosampletheflux
the technique one of the most widely applied procedures in of photons temporally, and using statistical procedures of
biochemical studies (see Section III). As for small ions, the autocorrelation the counts are processed to produce a re-
understanding of the conductance of ionic solutions has laxation curve with an exponential decay of the first-order
not been seriously pursued in recent times, so the need to correlation function with time. The time constant of the
develop new experimental procedures that use boundaries curve is related to the diffusion constant of the scattering
has not been present. macroions and therefore provides a measure of the diffu-
sion of the ions. These measurements are obtained from
a solution that is at true equilibrium, and no separation
B. Electrophoretic Light Scattering
occurs during the experiment.
A development in light scattering in the 1970s made it pos- Electrophoretic applications of this method depend on
sible to study the electrophoretic movement of macroions the known inverse relationship between the first-order cor-
without forming boundaries. The physical principle be- relation function and the power spectrum. (They are a
hind the technique was to measure molecular motions Fourier transform pair.) With random motion the frequen-
through the Doppler shift in the frequency of scattered cies of the scattered light spread about the incident light,
lightrelativetotheincidentbeam.Themeasurementswere producing a Lorentzian distribution (the center being at
made using a single-mode laser as the source of light. the frequency of the incident light; the spectrum is known
When light is scattered from a stationary object, its fre- as a Rayleigh line to distinguish it from other spectral