
Page 149 - Academic Press Encyclopedia of Physical Science and Technology 3rd Analytical Chemistry
P. 149
P1: GLM/GJK P2: GRB Final Pages
Encyclopedia of Physical Science and Technology En005H-218 June 15, 2001 20:33
Electrophoresis 377
restrict the movement of the polyampholyte. Then a se- ing complex biological mixtures of macroions. In this evo-
ries of buffer zones must be inserted, and both the type lution, attempts were made to expand to two-dimensional
and the concentrations of these buffers must be controlled separations, but only recently has this procedure been suc-
so that a pH gradient is generated yet the ionic strength in cessful. The method illustrates the resolving power pro-
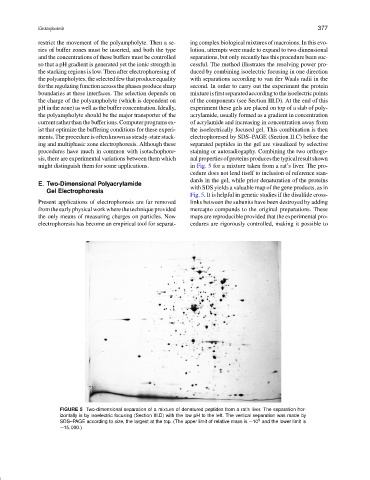
the stacking regions is low. Then after electrophoresing of duced by combining isoelectric focusing in one direction
the polyampholytes, the selected few that produce equality with separations according to van der Waals radii in the
for the regulating function across the phases produce sharp second. In order to carry out the experiment the protein
boundaries at these interfaces. The selection depends on mixtureisfirstseparatedaccordingtotheisoelectricpoints
the charge of the polyampholyte (which is dependent on of the components (see Section III.D). At the end of this
pH in the zone) as well as the buffer concentration. Ideally, experiment these gels are placed on top of a slab of poly-
the polyampholyte should be the major transporter of the acrylamide, usually formed as a gradient in concentration
current rather than the buffer ions. Computer programs ex- of acrylamide and increasing in concentration away from
ist that optimize the buffering conditions for these experi- the isoelectrically focused gel. This combination is then
ments. The procedure is often known as steady-state stack- electrophoresed by SDS–PAGE (Section II.C) before the
ing and multiphasic zone electrophoresis. Although these separated peptides in the gel are visualized by selective
procedures have much in common with isotachophore- staining or autoradiogaphy. Combining the two orthogo-
sis, there are experimental variations between them which nalpropertiesofproteinsproducesthetypicalresultshown
might distinguish them for some applications. in Fig. 5 for a mixture taken from a rat’s liver. The pro-
cedure does not lend itself to inclusion of reference stan-
dards in the gel, while prior denaturation of the proteins
E. Two-Dimensional Polyacrylamide
Gel Electrophoresis with SDS yields a valuable map of the gene products, as in
Fig. 5. It is helpful in genetic studies if the disulfide cross-
Present applications of electrophoresis are far removed links between the subunits have been destroyed by adding
fromtheearlyphysicalworkwherethetechniqueprovided mercapto compunds to the original preparations. These
the only means of measuring charges on particles. Now maps are reproducible provided that the experimental pro-
electrophoresis has become an empirical tool for separat- cedures are rigorously controlled, making it possible to
FIGURE 5 Two-dimensional separation of a mixture of denatured peptides from a rat’s liver. The separation hor-
izontally is by isoelectric focusing (Section III.D) with the low pH to the left. The vertical separation was made by
5
SDS–PAGE according to size, the largest at the top. (The upper limit of relative mass is ∼10 and the lower limit is
∼15,000.)