
Page 197 - Academic Press Encyclopedia of Physical Science and Technology 3rd Analytical Chemistry
P. 197
P1: GRB/MBQ P2: GLM Final Pages
Encyclopedia of Physical Science and Technology EN007C-340 July 10, 2001 14:45
808 Infrared Spectroscopy
Here (I 0 /I) can be recognized as the reciprocal of the
transmittance (1/T). The quantity b is the cell thickness
and c the sample concentration in the solution. The quan-
tity a is called the absorptivity, which is a constant char-
acterizing the capacity of the sample to absorb radiation.
Its value varies with the wavelength or frequency of the
radiation being measured and with the units used for cell
thickness and sample concentration.
Beer’s law is more simply expressed as
A = abc, (17)
where A is called the absorbance, defined as
A = log (I 0 /I) or A = log (1/T ). (18)
10 10
If the cell thickness and the radiation wavelength are held
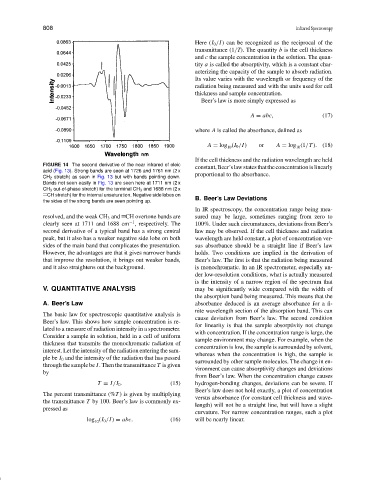
FIGURE 14 The second derivative of the near infrared of oleic
constant,Beer’slawstatesthattheconcentrationislinearly
acid (Fig. 13). Strong bands are seen at 1726 and 1761 nm (2 x
proportional to the absorbance.
CH 2 stretch) as seen in Fig. 13 but with bands pointing down.
Bands not seen easily in Fig. 13 are seen here at 1711 nm (2 x
CH 3 out-of-phase stretch) for the terminal CH 3 and 1688 nm (2 x
CH stretch) for the internal unsaturation. Negative side lobes on
the sides of the strong bands are seen pointing up. B. Beer’s Law Deviations
In IR spectroscopy, the concentration range being mea-
resolved, and the weak CH 3 and CH overtone bands are sured may be large, sometimes ranging from zero to
−1
clearly seen at 1711 and 1688 cm , respectively. The 100%. Under such circumstances, deviations from Beer’s
second derivative of a typical band has a strong central law may be observed. If the cell thickness and radiation
peak, but it also has a weaker negative side lobe on both wavelength are held constant, a plot of concentration ver-
sides of the main band that complicates the presentation. sus absorbance should be a straight line if Beer’slaw
However, the advantages are that it gives narrower bands holds. Two conditions are implied in the derivation of
that improve the resolution, it brings out weaker bands, Beer’slaw.The first is that the radiation being measured
and it also straightens out the background. is monochromatic. In an IR spectrometer, especially un-
der low-resolution conditions, what is actually measured
is the intensity of a narrow region of the spectrum that
V. QUANTITATIVE ANALYSIS may be significantly wide compared with the width of
the absorption band being measured. This means that the
A. Beer’sLaw absorbance deduced is an average absorbance for a fi-
nite wavelength section of the absorption band. This can
The basic law for spectroscopic quantitative analysis is
cause deviation from Beer’s law. The second condition
Beer’s law. This shows how sample concentration is re-
for linearity is that the sample absorptivity not change
lated to a measure of radiation intensity in a spectrometer.
with concentration. If the concentration range is large, the
Consider a sample in solution, held in a cell of uniform
sample environment may change. For example, when the
thickness that transmits the monochromatic radiation of
concentration is low, the sample is surrounded by solvent,
interest. Let the intensity of the radiation entering the sam-
whereas when the concentration is high, the sample is
ple be I 0 and the intensity of the radiation that has passed
surrounded by other sample molecules. The change in en-
through the sample be I. Then the transmittance T is given
vironment can cause absorptivity changes and deviations
by
from Beer’s law. When the concentration change causes
T = I/I 0 . (15) hydrogen-bonding changes, deviations can be severe. If
Beer’s law does not hold exactly, a plot of concentration
The percent transmittance (%T ) is given by multiplying
versus absorbance (for constant cell thickness and wave-
the transmittance T by 100. Beer’s law is commonly ex-
length) will not be a straight line, but will have a slight
pressed as
curvature. For narrow concentration ranges, such a plot
log (I 0 /I) = abc. (16) will be nearly linear.
10