
Page 196 - Academic Press Encyclopedia of Physical Science and Technology 3rd Analytical Chemistry
P. 196
P1: GRB/MBQ P2: GLM Final Pages
Encyclopedia of Physical Science and Technology EN007C-340 July 10, 2001 14:45
Infrared Spectroscopy 807
IV. THE NEAR INFRARED REGION TABLE III Selected Near Infrared Characteristic Bands
Group nm cm −1 Assignment a
A. Qualitative and Quantitative Analyses
CH 3 1680–1760 5950–5680 2 x CH 3 str.
The region of the near infrared spectrum extends from
CH 3 2240–2360 4465–4235 CH 3 str. + bend
−1
about 700 nm (14,000 cm ) near the end of the visible re-
>C CH 2 1625–1675 6155–5970 2 x CH 2 asym. str.
−1
gion, to 2500 nm (4,000 cm ), which is the beginning of
cis–CH CH 2120–2170 4715–4610 CH str. + C C str.
the infrared fundamental region. The HF molecule, for ex- C C H 1520–1565 6580–6390 2 x C–H str.
−1
ample, has its fundamental absorption band at 3962 cm . b
R OH, H 2 O 1385–1460 7220–6850 2 x OH str.
The near infrared spectrum of water is shown in Fig. 12. b
H 2 O 1880–1950 5290–5130 H 2 O str. + bend
The near infrared region is populated with overtone and
R 2 NH 1520–1560 6580–6410 2 x NH str.
combination bands of lower frequency fundamentals be-
R SH 1960–2020 5100–4950 2 x SH str.
−1
low 4,000 cm . These bands are considerably weaker in
>C O 1920–1970 5810–5075 3 x C O str.
intensity than fundamental bands. The intensity weakness
a str, stretch.
is an advantage for quantitative analyses, particularly in
b Varies with changes in hydrogen bonding.
production processing, because the larger cell thicknesses
used can be better controlled, yielding more reproducia-
ble intensity measurements. The cells can be made with B. Derivative Spectra
water-insoluable quartz or saphire windows for example,
In the near infrared region, the bands are not only weaker,
which if they are thin enough, can transmit down to about
−1
3000 cm . On the negative side, the qualitative informa- they can be broader and more overlapping. For example,
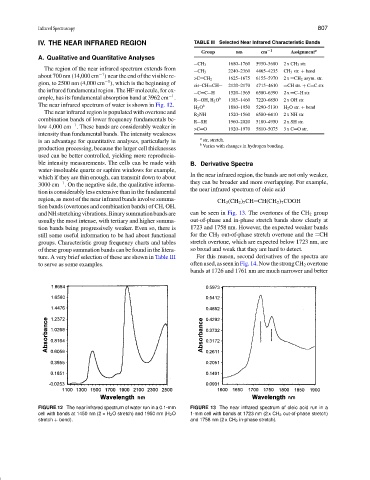
the near infrared spectrum of oleic acid
tion is considerably less extensive than in the fundamental
region, as most of the near infrared bands involve summa- CH 3 (CH 2 ) 7 CH CH(CH 2 ) 7 COOH
tion bands (overtones and combination bands) of CH, OH,
andNHstretchingvibrations.Binarysummationbandsare can be seen in Fig. 13. The overtones of the CH 2 group
usually the most intense, with tertiary and higher summa- out-of-phase and in-phase stretch bands show clearly at
tion bands being progressively weaker. Even so, there is 1723 and 1758 nm. However, the expected weaker bands
still some useful information to be had about functional for the CH 3 out-of-phase stretch overtone and the CH
groups. Characteristic group frequency charts and tables stretch overtone, which are expected below 1723 nm, are
of these group summation bands can be found in the litera- so broad and weak that they are hard to detect.
ture. A very brief selection of these are shown in Table III For this reason, second derivatives of the spectra are
to serve as some examples. oftenused,asseeninFig.14.NowthestrongCH 2 overtone
bands at 1726 and 1761 nm are much narrower and better
FIGURE 12 The near infrared spectrum of water run in a 0.1-mm FIGURE 13 The near infrared spectrum of oleic acid run in a
cell with bands at 1450 nm (2 × H 2 O stretch) and 1950 nm (H 2 O 1-mm cell with bands at 1723 nm (2 x CH 2 out-of-phase stretch)
stretch + bend). and 1758 nm (2 x CH 2 in-phase stretch).