
Page 198 - Academic Press Encyclopedia of Physical Science and Technology 3rd Analytical Chemistry
P. 198
P1: GRB/MBQ P2: GLM Final Pages
Encyclopedia of Physical Science and Technology EN007C-340 July 10, 2001 14:45
Infrared Spectroscopy 809
C. Measurement of Absorbance ment is somewhat sensitive to instrument resolution. If the
resolution is reduced, a narrow-shaped band will become
There are a variety of ways of measuring the absorbance.
broader and the peak height will be reduced. The inte-
In a single-beam spectrum the vertical coordinate I is a
grated intensity is a measure of the total band area, and
measure of the source radiation intensity (at a given wave-
thisshowsmuchlesssensitivitytoinstrumentalresolution.
length) attenuated by sample absorption and atmospheric
Furthermore, it has greater theoretical significance in that
carbon dioxide and water vapor absorption. A reference
the integrated band intensity is a measure of the total ra-
single-beamspectrumisrunwiththesameinstrumentcon-
diation energy absorbed for this vibrational mode and it is
ditions but without the sample. Let this vertical coordinate
proportional to the square of the change in dipole moment
be I 0 . If the vertical coordinates of these two spectra are
with respect to the change in the normal coordinate.
divided, wavelength by wavelength, a spectrum is gen-
One way to characterize the band intensity is to express
erated where the vertical coordinate is transmittance or,
it as the integrated absorptivity as a function of wave num-
when multiplied by 100, percent transmittance. This is
ber. From Beer’s law the absorptivity a is equal to A/(bc),
not the percent transmittance of the chemical sample, but
which means that the integrated intensity can be expressed
rather that of the whole cell assembly. In addition to the
as the absorbance A, integrated over the whole band, di-
absorption of radiation by the sample, radiation can be lost
videdby bc.Ifthespectrumofasolutionisplottedwiththe
by cell reflection and scattering of radiation, as well as by −1
horizontal coordinate linear with wave number ¯ν (cm )
beam blockage by an undersized cell aperture or by beam
and the vertical coordinate linear with absorbance A, then
attenuation. A background correction must be made.
the band area, corrected for background and divided by bc,
If the vertical coordinate of the spectrum is linear with
is the integrated intensity. If the cell length is measured
percenttransmittance,thenthepercenttransmittanceread-
in centimeters and the concentration is measured in moles
ing at, say, the bottom of a sample band is taken to be
per cubic centimeter, then the integrated absorptivity is in
proportional to I. The percent transmittance at the same
centimeters per mole. Other units have been used.
wavelength is read for the background point, that is, where
the recorder pen would be if there were no sample band.
This is taken as proportional to I 0 . From these values for E. Base Line Method
I and I 0 the background corrected sample absorbance can
A popular way to do a quantitative analysis from recorded
be calculated as log (I 0 /I). spectra is the base line method. In this method, taking a
10
Sometimes the vertical coordinate of the spectrum is the percent transmittance or absorbance reading of the band
absorbance value rather than the percent transmittance. In peak is straightforward. It is the method of getting the
this case, the absorbance reading at the band peak is cor- backgroundpercenttransmittanceorabsorbancethatgives
rected by subtracting the absorbance reading of the back-
the method its name. Again, one tries to imagine where the
ground point at the same wavelength where the recorder
recorder pen would be if the component being measured
pen would be if there were no sample band.
were not present. If one has an isolated band in a region
If the solvent has some absorption at the analytical
with no other absorption, the background line is easy to
wavelength or wave number, both the sample and solvent
draw as a line tangent to the spectral background. If one
contribute to the total absorbance. Beer’s law is additive;
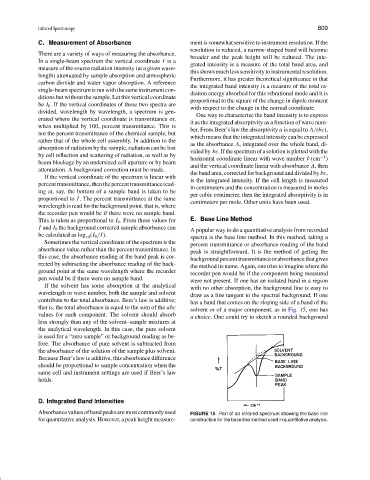
has a band that comes on the sloping side of a band of the
that is, the total absorbance is equal to the sum of the abc
solvent or of a major component, as in Fig. 15, one has
values for each component. The solvent should absorb
a choice. One could try to sketch a rounded background
less strongly than any of the solvent–sample mixtures at
the analytical wavelength. In this case, the pure solvent
is used for a “zero sample” or background reading as be-
fore. The absorbance of pure solvent is subtracted from
the absorbance of the solution of the sample plus solvent.
Because Beer’s law is additive, this absorbance difference
should be proportional to sample concentration when the
same cell and instrument settings are used if Beer’slaw
holds.
D. Integrated Band Intensities
Absorbancevaluesofbandpeaksaremostcommonlyused FIGURE 15 Part of an infrared spectrum showing the base line
for quantitative analysis. However, a peak height measure- construction for the base line method used in quantitative analysis.