
Page 243 - Academic Press Encyclopedia of Physical Science and Technology 3rd Analytical Chemistry
P. 243
P1: GRB/GWT P2: GPJ/GAX QC: GAE/FYD Final Pages
Encyclopedia of Physical Science and Technology EN008M-395 June 29, 2001 15:52
968 Magnetic Resonance in Medicine
TABLE II Proton Relaxation Times for Various Substances in level populations given by Eq. (1). Once saturation has
◦
(37 C) a occurred it is necessary to wait for a time approximately
equal to T 1 to permit the magnetization to rebuild [Eq. (8)]
T 1 (msec)
before further signals can be obtained from the specimen.
25 MHz 64 MHz T 2 (msec)
An additional time consideration is the duration of the
rf pulse necessary to carry out the desired rotations of the
Pure water (deoxygenated) 4500 4500 2900
magnetization. The length of this pulse is usually a few
Cerebrospinal fluid 4300 4300 2200
milliseconds or less. This is much shorter than T 1 or T 2 for
Blood (oxygenated) 860 940 350
the tissues of interest. Thus, there is no significant change
Skeletal muscle 585 870 47
in the length of the magnetization vector during the time
Brain
that the rf pulse is being applied.
White matter 520 557 72
The relaxation times of protons in several human tissues
Cortical gray matter 690 920 100
areindicatedinTableII.P.A.Bottomleyandhiscoworkers
Liver
have carried out extensive analysis of the published data,
Normal 345 490 43
and have concluded that a large variability exists from one
Hepatoma 810 1080 84
investigation to another in published values for relaxation
Fat 220 260 84
times. Therefore, the values in Table II should not be re-
Multiple sclerosis plaque
(mean) — 1315 174 garded as precise—standard deviations of ±10% or more
in the data are not unusual. It is likely that the improved
a Adapted from data in Bottomley, et al. (1984). Med. Phys. 11, instrumentation now available, and the recently acquired
425–448; Bottomley, et al. (1987). Med. Phys. 14, 1–37; Hopkins, et al. significance of this data will lead to a rapid improvement
(1986). Magn. Reson. Med. 3, 303–311; Brooks, and DiChiro, (1987).
Med. Phys. 14, 903–913; Hardy, et al. (1986). Magn. Reson. Med. 3, in the precision and accuracy with which T 1 and T 2 values
935–940; Larsson, et al. (1988). Magn. Reson. Med. 7, 43–55. for human tissues are known. In general, it appears that for
most human tissues T 1 is substantially larger than T 2 . For
rebuilds toward its equilibrium value. At the same time protons T 1 increases in a significant way as the static field
transverse magnetization is precessing and producing a strength, and thereby the Larmor frequency is increased.
FID signal. Of course, M z will not have completely However, T 2 tends to remain constant, or decrease slightly,
achieved its steady-state value M 0 by the time of the subse- as the frequency is increased.
◦
quent 90 pulse. If the pulses are repeated too rapidly, the As an example of the use of relaxation times to discrim-
Bloch equations show that the magnitude of the FID goes inate between normal and malignant tissues, the values for
to zero, an effect called saturation. From a quntum me- both liver and for a hepatoma, a tumor derived from liver
chanical point of view, saturation is the result of an exces- tissue, are given in Table II. In many cases, however, the
sive amount of B 1 excitation that eliminates the difference relaxation time differences between normal and malignant
tissues are not so clear cut.
The concept of the T 2 decay is usually explained using
the idea of the dephasing of the nuclear spins present in the
sample. Consider a transverse magnetization that has been
created by a 90 pulse. All the spins in the sample have
◦
experienced the same applied magnetic field and imme-
diately after the pulse they all have the same phase. That
is, their individual nuclear moments are all pointed in the
same direction and the induced voltage they produce in
the receiver coil is at its maximum. Once the externally
applied B 1 field is removed, however, the individual nu-
clei are still subjected to the weaker, but persistent, effects
of their different local environments. At any instant this
leads some nuclei to be precessing faster, and some slower,
than the average rate of precession, which is given by the
Larmor frequency, set by the external field B 0 . The result
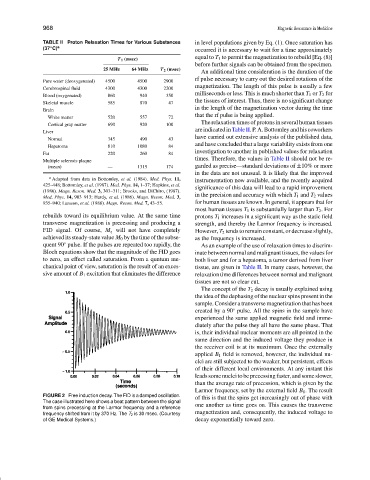
FIGURE 2 Free induction decay. The FID is a damped oscillation. of this is that the spins get increasingly out of phase with
The case illustrated here shows a beat pattern between the signal
from spins precessing at the Larmor frequency and a reference one another as time goes on. This causes the transverse
frequency shifted from it by 370 Hz. The T 2 is 30 msec. (Courtesy magnetization and, consequently, the induced voltage to
of GE Medical Systems.) decay exponentially toward zero.