
Page 279 - Academic Press Encyclopedia of Physical Science and Technology 3rd Analytical Chemistry
P. 279
P1: GSR/GLE P2: FXY Final Pages
Encyclopedia of Physical Science and Technology EN009G-958 July 18, 2001 0:57
Mass Spectrometry in Forensic Science 167
FIGURE 8 Detector: schematic figure of electron multiplier.
Three examples have been selected to show how MS has
become an indispensable analytical tool.
A. Toxicology
The search for drug substances, pesticides, poisons, and
their metabolites in body fluids from living persons or
in postmortem organs presents an important and difficult
task for the chemist. In addition to the fact that the forensic
scientist most often does not know what intoxicant to look
for, the main reason for using MS to begin with is the
large number of possible toxic substances. In toxicology
work at the Poison Center in Munich, as many as 8000
different substances have, in fact, been reported in 40,000
investigated objects.
Figure 9 shows an outline of the usual MS approach
for searching a biological sample taken from a human for
alien compounds with pharmacological effects. The ex-
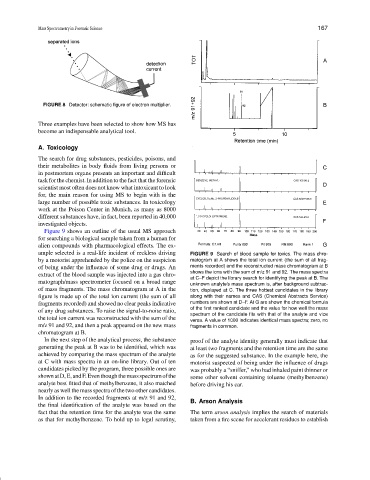
ample selected is a real-life incident of reckless driving FIGURE 9 Search of blood sample for toxics. The mass chro-
by a motorist apprehended by the police on the suspicion matogram at A shows the total ion current (the sum of all frag-
of being under the influence of some drug or drugs. An ments recorded) and the reconstructed mass chromatogram at B
shows the ions with the sum of m/z 91 and 92. The mass spectra
extract of the blood sample was injected into a gas chro-
at C–F depict the library search for identifying the peak at B. The
matograph/mass spectrometer focused on a broad range unknown analyte’s mass spectrum is, after background subtrac-
of mass fragments. The mass chromatogram at A in the tion, displayed at C. The three hottest candidates in the library
figure is made up of the total ion current (the sum of all along with their names and CAS (Chemical Abstracts Service)
fragments recorded) and showed no clear peaks indicative numbers are shown at D–F. At G are shown the chemical formula
of the first ranked candidate and the value for how well the mass
of any drug substances. To raise the signal-to-noise ratio,
spectrum of the candidate fits with that of the analyte and vice
the total ion current was reconstructed with the sum of the versa. A value of 1000 indicates identical mass spectra; zero, no
m/z 91 and 92, and then a peak appeared on the new mass fragments in common.
chromatogram at B.
In the next step of the analytical process, the substance proof of the analyte identity generally must indicate that
generating the peak at B was to be identified, which was at least two fragments and the retention time are the same
achieved by comparing the mass spectrum of the analyte as for the suggested substance. In the example here, the
at C with mass spectra in an on-line library. Out of ten motorist suspected of being under the influence of drugs
candidates picked by the program, three possible ones are was probably a “sniffer,” who had inhaled paint thinner or
shownatD,E,andF.Eventhoughthemassspectrumofthe some other solvent containing toluene (methylbenzene)
analyte best fitted that of methylbenzene, it also matched before driving his car.
nearly as well the mass spectra of the two other candidates.
In addition to the recorded fragments at m/z 91 and 92,
B. Arson Analysis
the final identification of the analyte was based on the
fact that the retention time for the analyte was the same The term arson analysis implies the search of materials
as that for methylbenzene. To hold up to legal scrutiny, taken from a fire scene for accelerant residues to establish