
Page 327 - Academic Press Encyclopedia of Physical Science and Technology 3rd Analytical Chemistry
P. 327
P1: GNH Final Pages
Encyclopedia of Physical Science and Technology EN009N-447 July 19, 2001 23:3
844 Microwave Molecular Spectroscopy
there are only two independent coupling constants. The
above may also be applied to an oblate asymmetric rotor
with replacement of a by c and b p by b 0 . The selection
rules J = 0, ± 1, F = 0, ±1, and I = 0 apply along
with those cited previously for τ. The calculation of
the hyperfine structure for an asymmetric top requires a
2
knowledge of the reduced energies and values of P for
a
the two levels involved in the transition. These may be
obtained (see Section IV) once the rotational constants
are specified. The χ aa and η are then adjusted to obtain
agreement between the observed and predicted hyperfine
patterns.
As an example of a hyperfine pattern, we give in Fig. 24
the observed spectrum for the 0 0,0 → 1 1,1 transition of
14
CH 3 CH 2 NC. The splittings due to N are very small and
14
high-resolution techniques are required. Since I( N) = 1,
we have for the J = 0 level, F = 1, and for the J = 1 level,
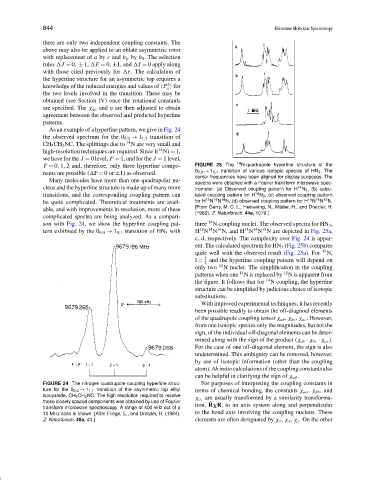
F = 0, 1, 2 and, therefore, only three hyperfine compo- FIGURE 25 The 14 N-quadrupole hyperfine structure of the
0 0,0 → 1 0,1 transition of various isotopic species of HN 3 . The
nents are possible ( F = 0or ±1) as observed.
center frequencies have been aligned for display purposes. The
Many molecules have more than one quadrupolar nu-
spectra were obtained with a Fourier transform microwave spec-
cleus and the hyperfine structure is made up of many more trometer. (a) Observed coupling pattern for H N 3 , (b) calcu-
14
14
transitions, and the corresponding coupling pattern can lated coupling pattern for H N 3 , (c) observed coupling pattern
15
14
14
15
14
14
be quite complicated. Theoretical treatments are avail- for H N N N, (d) observed coupling pattern for H N N N.
able, and with improvements in resolution, more of these [From Gerry, M. C. L., Heineking, N., M¨ader, H., and Dreizler, H.
(1989). Z. Naturforsch. 44a, 1079.]
complicated spectra are being analyzed. As a compari-
14
son with Fig. 24, we show the hyperfine coupling pat- three N-coupling nuclei. The observed spectra for HN 3 ,
15
15
14
14
14
14
tern exhibited by the 0 0,0 → 1 0,1 transition of HN 3 with H N N N, and H N N N are depicted in Fig. 25a,
c, d, respectively. The complexity over Fig. 24 is appar-
ent. The calculated spectrum for HN 3 (Fig. 25b) compares
15
quite well with the observed result (Fig. 25a). For N,
1
I = and the hyperfine coupling pattern will depend on
2
14
only two N nuclei. The simplification in the coupling
14
15
patterns when one N is replaced by N is apparent from
the figure. It follows that for 14 N coupling, the hyperfine
structure can be simplified by judicious choice of isotopic
substitutions.
With improved experimental techniques, it has recently
been possible readily to obtain the off-diagnoal elements
of the quadrupole coupling tensor χ ab , χ bc , χ ac . However,
from one isotopic species only the magnitudes, but not the
sign, of the individual off-diagonal elements can be deter-
mined along with the sign of the product (χ ab · χ bc · χ ac ).
For the case of one off-diagonal element, the sign is also
undetermined. This ambiguity can be removed, however,
by use of isotopic information (other than the coupling
atom). Ab initio calculations of the coupling constants also
can be helpful in clarifying the sign of χ αβ .
FIGURE 24 The nitrogen quadrupole coupling hyperfine struc- For purposes of interpreting the coupling constants in
ture for the 0 0,0 → 1 1,1 transition of the asymmetric top ethyl terms of chemical bonding, the constants χ aa , χ bb , and
isocyanide, CH 3 CH 2 NC. The high resolution required to resolve χ cc are usually transformed by a similarity transforma-
these closely spaced components was obtained by use of Fourier ˜
transform microwave spectroscopy. A range of 400 kHz out of a tion, RχR, to an axis system along and perpendicular
10 MHz scan is shown. [After Fliege, E., and Dreizler, H. (1984). to the bond axis involving the coupling nucleus. These
Z. Naturforsch. 40a, 43.] elements are often designated by χ x , χ y , χ z . On the other