
Page 421 - Academic Press Encyclopedia of Physical Science and Technology 3rd Analytical Chemistry
P. 421
P1: GLQ Final pages
Encyclopedia of Physical Science and Technology EN012C-568 July 26, 2001 15:32
Photoelectron Spectroscopy 71
A variety of theoretical models have been developed
in which relaxation is taken into account (transition state
models, relaxed potential models, equivalent core mod-
els). A discussion of these models is far beyond the scope
of this article. Here, we will only add some comments on
methods by which it is possible to separate initial and fi-
nal state effects with the use of experimentally available
data. These methods are based on a combination of PE
and Auger electron spectroscopy. We consider an Auger
transition from an initial state with a single hole in the in-
ner shell k to a final state with two holes in another inner
shell i. This Auger transition is combined with photoion-
ization processes that correspond to the photoemission of
an electron from orbital k and from orbital i. This yields
Au
β(i) = E kin (kii) + 2 E B (i) − E B (k)
= 2 R i − R ii (13)
where R ii is the relaxation contribution of the double-
hole final state of the Auger transition. The parameter
β(i) is independent of the reference level. Therefore, it
can be obtained for molecules in the gas phase as well as
for solids. Since it is independent of the reference level,
it is also independent of sample charging if the Auger ki-
netic energy E Au (kii) and the binding energies are derived
kin
from the same measurement. When we introduce the ap-
proximation that the relaxation energy results mainly from
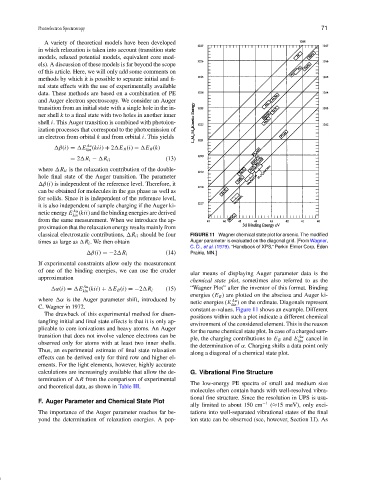
classical electrostatic contributions, R ii should be four FIGURE 11 Wagner chemical state plot for arsenic. The modified
times as large as R i . We then obtain Auger parameter is evaluated on the diagonal grid. [From Wagner,
C. D., et al. (1979). “Handbook of XPS,” Perkin Elmer Corp, Eden
β(i) =−2 R i (14) Prairie, MN.]
If experimental constraints allow only the measurement
of one of the binding energies, we can use the cruder
ular means of displaying Auger parameter data is the
approximation
chemical state plot, sometimes also referred to as the
α(i) = E Au (15) “Wagner Plot” after the inventor of this format. Binding
kin (kii) + E B (i) =−2 R i
energies (E B ) are plotted on the abscissa and Auger ki-
where α is the Auger parameter shift, introduced by Au
netic energies (E kin ) on the ordinate. Diagonals represent
C. Wagner in 1972.
constant α-values. Figure 11 shows an example. Different
The drawback of this experimental method for disen-
positions within such a plot indicate a different chemical
tangling initial and final state effects is that it is only ap-
environment of the considered element. This is the reason
plicable to core ionizations and heavy atoms. An Auger
for the name chemical state plot. In case of a charged sam-
transition that does not involve valence electrons can be Au
ple, the charging contributions to E B and E kin cancel in
observed only for atoms with at least two inner shells.
the determination of α. Charging shifts a data point only
Thus, an experimental estimate of final state relaxation
along a diagonal of a chemical state plot.
effects can be derived only for third row and higher el-
ements. For the light elements, however, highly accurate
calculations are increasingly available that allow the de- G. Vibrational Fine Structure
termination of R from the comparison of experimental
The low-energy PE spectra of small and medium size
and theoretical data, as shown in Table III.
molecules often contain bands with well-resolved vibra-
tional fine structure. Since the resolution in UPS is usu-
F. Auger Parameter and Chemical State Plot −1
ally limited to about 150 cm (≈15 meV), only exci-
The importance of the Auger parameter reaches far be- tations into well-separated vibrational states of the final
yond the determination of relaxation energies. A pop- ion state can be observed (see, however, Section I.I). As