
Page 417 - Academic Press Encyclopedia of Physical Science and Technology 3rd Analytical Chemistry
P. 417
P1: GLQ Final pages
Encyclopedia of Physical Science and Technology EN012C-568 July 26, 2001 15:32
Photoelectron Spectroscopy 67
process 3 in Fig. 2 and, in a further extension of the above valence orbitals and the vibrational structure of the cor-
ideas, is called a “shake-off” process. Since the second responding photoemission bands (Section II.G), shake-up
electron is no longer bound, shake-off excitations lead to structures in the valence region are more difficult to ob-
a continuum. This corresponds to the continuum following serve. Figure 3 shows an example where it was possible to
discrete excitations in the optical spectrum of the ion. detectashake-upstructure(indicated2h1p)bycomparison
Examples of the processes discussed above are seen in with the optical spectrum of the ion. A transition from the
the photoemission spectrum of neon (Fig. 1a). The first ion ground state M to this particular 2h1p state is allowed
+
0
line appears at 21.6 eV, corresponding to photoionization and leads to a strong band in the absorption spectrum of
of one of the six 2p electrons. The second line, at 49 eV, the ion. In the PE spectrum, which starts from M 0 instead
+
corresponds to photoionization of a 2s electron and the of M , the 2h1p final state gives rise to only a weak struc-
0
third line, at 870 eV, to photoionization of a 1s electron. ture. From the PE spectrum alone it would be difficult to
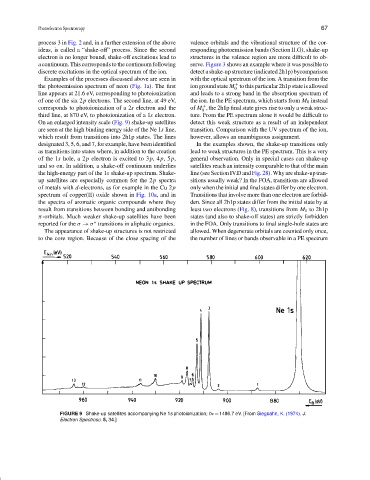
On an enlarged intensity scale (Fig. 9) shake-up satellites detect this weak structure as a result of an independent
are seen at the high binding energy side of the Ne 1s line, transition. Comparison with the UV spectrum of the ion,
which result from transitions into 2h1p states. The lines however, allows an unambiguous assignment.
designated 3, 5, 6, and 7, for example, have been identified In the examples shown, the shake-up transitions only
as transitions into states where, in addition to the creation lead to weak structures in the PE spectrum. This is a very
of the 1s hole, a 2p electron is excited to 3p,4p,5p, general observation. Only in special cases can shake-up
and so on. In addition, a shake-off continuum underlies satellites reach an intensity comparable to that of the main
the high-energy part of the 1s shake-up spectrum. Shake- line (see Section IV.D and Fig. 28). Why are shake-up tran-
up satellites are especially common for the 2p spectra sitions usually weak? In the FOA, transitions are allowed
of metals with d-electrons, as for example in the Cu 2p only when the initial and final states differ by one electron.
spectrum of copper(II) oxide shown in Fig. 10a, and in Transitions that involve more than one electron are forbid-
the spectra of aromatic organic compounds where they den. Since all 2h1p states differ from the initial state by at
result from transitions between bonding and antibonding least two electrons (Fig. 8), transitions from M 0 to 2h1p
π-orbitals. Much weaker shake-up satellites have been states (and also to shake-off states) are strictly forbidden
reported for the σ → σ transitions in aliphatic organics. in the FOA. Only transitions to final single-hole states are
∗
The appearance of shake-up structures is not restricted allowed. When degenerate orbitals are counted only once,
to the core region. Because of the close spacing of the the number of lines or bands observable in a PE spectrum
FIGURE 9 Shake-up satellites accompanying Ne 1s photoionization; hν = 1486.7 eV. [From Siegbahn, K. (1974). J.
Electron Spectrosc. 5, 34.]