
Page 8 - Academic Press Encyclopedia of Physical Science and Technology 3rd Analytical Chemistry
P. 8
P1: GJB Revised Pages
Encyclopedia of Physical Science and Technology En001f25 May 7, 2001 13:58
Analytical Chemistry 547
in organic or biological systems to acid–base character. of Cl and Br is that of Mohr, who used chromate ion
−
−
+
For example, organic nitrogen is converted to NH in the (CrO ), the end point being specified by the appearence
2−
4 4
Kjedahl method to be determined in a neutralization pro- of Ag 2 CrO 4 , which is brick red in color. The essence of
cedure as liberated NH 3 . the principle here is that the solubility of silver chromate
is much greater than that of silver halide. Accordingly, the
conditions of the titration can be adjusted such that the
2. Precipitation Titrations formation of silver chromate occurs only in the vicinity of
In this method, the reagent solution, added from a buret, the end point. In the Volhard method a standard solution of
−
+
is allowed to cause precipitation with the analyte, and the thiocyanate ion (SCN ) is titrated against Ag using Fe 3+
−
end point is associated with an abrupt change in the con- as the indicator. At the initial excess of SCN , a red color
centration of the reagent species. The equivalent weight of due to red Fe(SCN) 2+ is produced. An important applica-
a participant in a precipitation titration is the weight that tion of this method is the “backtitration” procedure for the
−
reacts with or provides 1 g formula weight of the reacting Cl ion. Here, an excess of standard silver nitrate solution
−
cation if it is univalent (0.5 for divalent, etc.). The tech- is added to the unknown Cl solution and then titrated
−
nique can be best understood by the example provided by with SCN with the Volhard indicator in place. Finally,
adsorption indicators (Fajans method) are employed that
the long-standing silver ion procedure for the determina-
are based on the adsorption of a colored organic compound
−
tion of halide anion, particularly Cl (sometimes termed
to the precipitate, only in the vicinity of the end point.
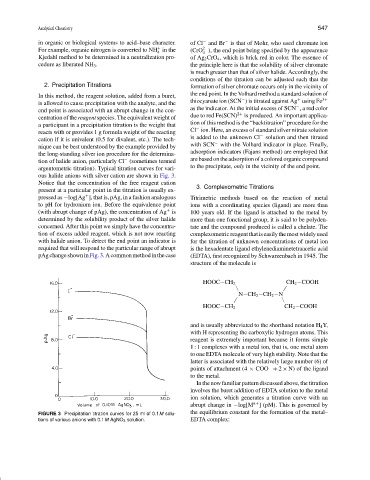
argentometric titration). Typical titration curves for vari-
ous halide anions with silver cation are shown in Fig. 3.
Notice that the concentration of the free reagent cation 3. Complexometric Titrations
present at a particular point in the titration is usually ex-
+
pressed as −log[Ag ], that is, pAg, in a fashion analogous Titrimetric methods based on the reaction of metal
to pH for hydronium ion. Before the equivalence point ions with a coordinating species (ligand) are more than
(with abrupt change of pAg), the concentration of Ag is 100 years old. If the ligand is attached to the metal by
+
determined by the solubility product of the silver halide more than one functional group, it is said to be polyden-
concerned. After this point we simply have the concentra- tate and the compound produced is called a chelate. The
tion of excess added reagent, which is not now reacting complexometricreagentthatiseasilythemostwidelyused
with halide anion. To detect the end point an indicator is for the titration of unknown concentrations of metal ion
required that will respond to the particular range of abrupt is the hexadentate ligand ethylenediaminetetraacetic acid
pAgchangeshowninFig.3.Acommonmethodinthecase (EDTA), first recognized by Schwarzenbach in 1945. The
structure of the molecule is
CH 2 −COOH
HOOC−CH 2
\\ /
N−CH 2 −CH 2 −N
/ \
CH 2 −COOH
HOOC−CH 2
and is usually abbreviated to the shorthand notation H 4 Y,
with H representing the carboxylic hydrogen atoms. This
reagent is extremely important because it forms simple
1 : 1 complexes with a metal ion, that is, one metal atom
to one EDTA molecule of very high stability. Note that the
latter is associated with the relatively large number (6) of
points of attachment (4 × COO + 2 × N) of the ligand
−
to the metal.
In the now familiar pattern discussed above, the titration
involves the buret addition of EDTA solution to the metal
ion solution, which generates a titration curve with an
n+
abrupt change in −log[M ] (pM). This is governed by
FIGURE 3 Precipitation titration curves for 25 ml of 0.1M solu- the equilibrium constant for the formation of the metal–
tions of various anions with 0.1M AgNO 3 solution. EDTA complex: