
Page 311 - Academic Press Encyclopedia of Physical Science and Technology 3rd Polymer
P. 311
P1: GQT/MBQ P2: GPJ Final Pages
Encyclopedia of Physical Science and Technology EN014C-660 July 28, 2001 17:14
Rheology of Polymeric Liquids 249
factor that enables one to superpose experimental data
obtained at different temperatures on a single master plot.
Note in Fig. 18 that G and G are defined, respectively,
r r
by G = (ρ 0 T 0 /ρT ) G (ω) and G = (ρ 0 T 0 /ρT )G (ω),
r r
where ρ 0 is the density at a reference temperature T 0 and
ρ is the density at temperature T . The following observa-
tions are worth noting in Fig. 18: (a) in the terminal region
the slope of log G versus log a T ω plots is 2 and the slope
r
of log G versus log a T ω plots is 1; (b) there is a very
r
long plateau region, from which the value of G 0 can be
N
determined. A characteristic feature of the plateau region
is that the magnitude of G is smaller than that of G ,as
illustrated in Fig. 18.
Today it is a well-accepted procedure that once the
value of G 0 is available, one can determine the molec-
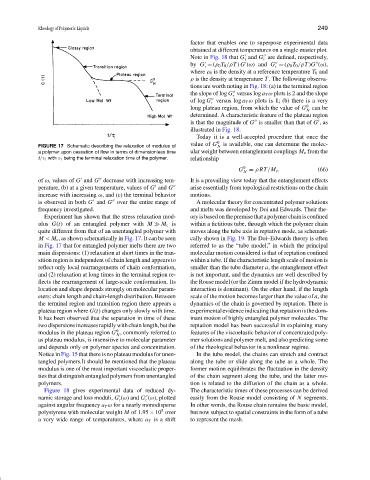
FIGURE 17 Schematic describing the relaxation of modulus of N
a polymer upon cessation of flow in terms of dimensionless time ular weight between entanglement couplings M e from the
t/τ 1 with τ 1 being the terminal relaxation time of the polymer. relationship
0
G = ρRT/M e . (66)
N
of ω, values of G and G decrease with increasing tem- It is a prevailing view today that the entanglement effects
perature, (b) at a given temperature, values of G and G arise essentially from topological restrictions on the chain
increase with increasing ω, and (c) the terminal behavior motions.
is observed in both G and G over the entire range of A molecular theory for concentrated polymer solutions
frequency investigated. and melts was developed by Doi and Edwards. Their the-
Experiment has shown that the stress relaxation mod- oryisbasedonthepremisethatapolymerchainisconfined
ulus G(t) of an entangled polymer with M M c is within a fictitious tube, through which the polymer chain
quite different from that of an unentangled polymer with moves along the tube axis in reptative mode, as schemati-
M < M c , as shown schematically in Fig. 17. It can be seen cally shown in Fig. 19. The Doi–Edwards theory is often
in Fig. 17 that for entangled polymer melts there are two referred to as the “tube model,” in which the principal
main dispersions: (1) relaxation at short times in the tran- molecular motion considered is that of reptation confined
sition region is independent of chain length and appears to within a tube. If the characteristic length scale of motion is
reflect only local rearrangements of chain conformation, smaller than the tube diameter a, the entanglement effect
and (2) relaxation at long times in the terminal region re- is not important, and the dynamics are well described by
flects the rearrangement of large-scale conformation. Its the Rouse model (or the Zimm model if the hydrodynamic
location and shape depends strongly on molecular param- interaction is dominant). On the other hand, if the length
eters: chain length and chain-length distribution. Between scale of the motion becomes larger than the value of a, the
the terminal region and transition region there appears a dynamics of the chain is governed by reptation. There is
plateau region where G(t) changes only slowly with time. experimentalevidenceindicatingthatreptationisthedom-
It has been observed that the separation in time of these inant motion of highly entangled polymer molecules. The
twodispersionsincreasesrapidlywithchainlength,butthe reptation model has been successful in explaining many
0
modulus in the plateau region G , commonly referred to features of the viscoelastic behavior of concentrated poly-
N
as plateau modulus, is insensitive to molecular parameter mer solutions and polymer melt, and also predicting some
and depends only on polymer species and concentration. of the rheological behavior in a nonlinear regime.
Notice in Fig. 15 that there is no plateau modulus for unen- In the tube model, the chains can stretch and contract
tangled polymers.It should be mentioned that the plateau along the tube or slide along the tube as a whole. The
modulus is one of the most important viscoelastic proper- former motion equilibrates the fluctuation in the density
ties that distinguish entangled polymers from unentangled of the chain segment along the tube, and the latter mo-
polymers. tion is related to the diffusion of the chain as a whole.
Figure 18 gives experimental data of reduced dy- The characteristic times of these processes can be derived
namic storage and loss moduli, G (ω) and G (ω), plotted easily from the Rouse model consisting of N segments.
r r
against angular frequency a T ω for a nearly monodisperse In other words, the Rouse chain remains the basic model,
5
polystyrene with molecular weight M of 1.95 × 10 over but now subject to spatial constraints in the form of a tube
a very wide range of temperatures, where a T is a shift to represent the mesh.