
Page 56 - Academic Press Encyclopedia of Physical Science and Technology 3rd Polymer
P. 56
P1: GQT/LBX P2: GQT/MBQ QC: FYD Final Pages
Encyclopedia of Physical Science and Technology EN008C-602 July 25, 2001 20:31
Macromolecules, Structure 871
along the concentration gradient in the cell. In mathemat-
ical terms, this means that force on a particle of mass m,
which is a distance r from the center of the rotor rotating
at angular velocity ω, is given by
2
F = ω r(1 − ¯vρ)m , (28)
where ρ is the density of the solution and ¯v is the partial
specific volume of the polymer. For ideal solutions it can
be shown from this expression that
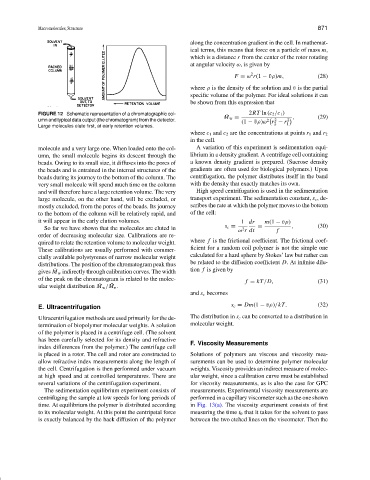
FIGURE 12 Schematic representation of a chromatographic col- 2RT ln (c 2 /c 1 )
¯
M w = , (29)
umn and typical data output (the chromatogram) from the detector. 2 2 2
(1 − ¯vρ)ω r − r
Large molecules elute first, at early retention volumes. 2 1
where c 1 and c 2 are the concentrations at points r 1 and r 2
in the cell.
molecule and a very large one. When loaded onto the col- A variation of this experiment is sedimentation equi-
umn, the small molecule begins its descent through the librium in a density gradient. A centrifuge cell containing
beads. Owing to its small size, it diffuses into the pores of a known density gradient is prepared. (Sucrose density
the beads and is entrained in the internal structures of the gradients are often used for biological polymers.) Upon
beads during its journey to the bottom of the column. The centrifugation, the polymer distributes itself in the band
very small molecule will spend much time on the column with the density that exactly matches its own.
and will therefore have a large retention volume. The very High speed centrifugation is used in the sedimentation
large molecule, on the other hand, will be excluded, or transport experiment. The sedimentation constant, s c , de-
mostly excluded, from the pores of the beads. Its journey scribes the rate at which the polymer moves to the bottom
to the bottom of the column will be relatively rapid, and of the cell:
it will appear in the early elution volumes. 1 dr m(1 − ¯vρ)
So far we have shown that the molecules are eluted in s c = ω r dt = f , (30)
2
order of decreasing molecular size. Calibrations are re-
quired to relate the retention volume to molecular weight. where f is the frictional coefficient. The frictional coef-
These calibrations are usually performed with commer- ficient for a random coil polymer is not the simple one
cially available polystyrenes of narrow molecular weight calculated for a hard sphere by Stokes’ law but rather can
distributions. The position of the chromatogram peak thus be related to the diffusion coefficient D. At infinite dilu-
¯
gives M w indirectly through calibration curves. The width tion f is given by
of the peak on the chromatogram is related to the molec- f = kT/D, (31)
¯
¯
ular weight distribution M w / M n .
and s c becomes
s c = Dm(1 − ¯vρ)/kT. (32)
E. Ultracentrifugation
Ultracentrifugation methods are used primarily for the de- The distribution in s c can be converted to a distribution in
termination of biopolymer molecular weights. A solution molecular weight.
of the polymer is placed in a centrifuge cell. (The solvent
has been carefully selected for its density and refractive F. Viscosity Measurements
index differences from the polymer.) The centrifuge cell
is placed in a rotor. The cell and rotor are constructed to Solutions of polymers are viscous and viscosity mea-
allow refractive index measurements along the length of surements can be used to determine polymer molecular
the cell. Centrifugation is then performed under vacuum weights. Viscosity provides an indirect measure of molec-
at high speed and at controlled temperatures. There are ular weight, since a calibration curve must be established
several variations of the centrifugation experiment. for viscosity measurements, as is also the case for GPC
The sedimentation equilibrium experiment consists of measurements. Experimental viscosity measurements are
centrifuging the sample at low speeds for long periods of performed in a capillary viscometer such as the one shown
time. At equilibrium the polymer is distributed according in Fig. 13(a). The viscosity experiment consists of first
to its molecular weight. At this point the centripetal force measuring the time t 0 that it takes for the solvent to pass
is exactly balanced by the back diffusion of the polymer between the two etched lines on the viscometer. Then the