
Page 59 - Academic Press Encyclopedia of Physical Science and Technology 3rd Polymer
P. 59
P1: GQT/LBX P2: GQT/MBQ QC: FYD Final Pages
Encyclopedia of Physical Science and Technology EN008C-602 July 25, 2001 20:31
874 Macromolecules, Structure
infrared spectrum, will appear as a number of lines, called
the Stokes lines, much weaker than the exciting radiation
and shifted to longer wavelength by a few hundred to two
or three thousand wave numbers. (Antistokes lines cor-
responding to excitation from a higher vibrational state
are also observed but are much weaker and not normally
employed.)
For Raman emission to occur, the polarizability of the
bond must change during the vibration. In polymers, most
lines appear in both infrared and Raman spectra, an impor-
tant exception being paraffinic carbon–carbon vibrations,
which are inactive in the infrared (vide supra) but active
in the Raman spectrum.
In polymers, as in small molecules, we may recognize
vibrational bands specific to particular types of bonds and
functional groups. These appear in the high-frequency
region of the spectrum regardless of the actual compound
or structure in which they occur. At the low-frequency
end of the spectrum, the vibrational bands are more char-
acteristic of the molecule as a whole. This region is com-
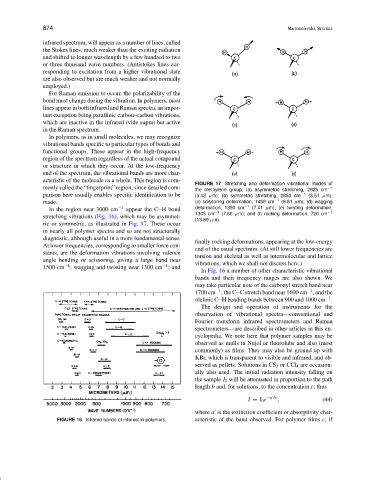
FIGURE 17 Stretching and deformation vibrational modes of
monly called the “fingerprint” region, since detailed com- the methylene group; (a) asymmetric stretching, 2926 cm −1
parison here usually enables specific identification to be (3.42 µm); (b) symmetric stretching, 2853 cm −1 (3.51 µm);
made. (c) scissoring deformation, 1468 cm −1 (6.81 µm); (d) wagging
In the region near 3000 cm −1 appear the C H bond deformation, 1350 cm −1 (7.41 µm); (e) twisting deformation,
1305 cm −1 (7.66 µm); and (f) rocking deformation, 720 cm −1
stretching vibrations (Fig. 16), which may be asymmet-
(13.89 µm).
ric or symmetric, as illustrated in Fig. 17. These occur
in nearly all polymer spectra and so are not structurally
diagnostic, although useful in a more fundamental sense.
finally rocking deformations, appearing at the low-energy
At lower frequencies, corresponding to smaller force con-
end of the usual spectrum. (At still lower frequencies are
stants, are the deformation vibrations involving valence
torsion and skeletal as well as intermolecular and lattice
angle bending or scissoring, giving a large band near vibrations, which we shall not discuss here.)
−1
−1
1500 cm ; wagging and twisting near 1300 cm ; and
In Fig. 16 a number of other characteristic vibrational
bands and their frequency ranges are also shown. We
may take particular note of the carbonyl stretch band near
−1
−1
1700 cm , the C C stretch band near 1600 cm , and the
−1
olefinic C H bending bands between 900 and 1000 cm .
The design and operation of instruments for the
observation of vibrational spectra—conventional and
Fourier transform infrared spectrometers and Raman
spectrometers—are described in other articles in this en-
cyclopedia. We note here that polymer samples may be
observed as mulls in Nujol or fluorolube and also (most
commonly) as films. They may also be ground up with
KBr, which is transparent to visible and infrared, and ob-
served as pellets. Solutions in CS 2 or CCl 4 are occasion-
ally also used. The initial radiation intensity falling on
the sample I 0 will be attenuated in proportion to the path
length b and, for solutions, to the concentration c; thus
I = I 0 e −a bc , (44)
where a is the extinction coefficient or absorptivity char-
FIGURE 16 Infrared bands of interest in polymers. acteristic of the band observed. For polymer films c,if