
Page 55 - Academic Press Encyclopedia of Physical Science and Technology 3rd Polymer
P. 55
P1: GQT/LBX P2: GQT/MBQ QC: FYD Final Pages
Encyclopedia of Physical Science and Technology EN008C-602 July 25, 2001 20:31
870 Macromolecules, Structure
where G is the free energy. A fluctuation in concentration
is related to the osmotic pressure [recall from Eq. (19) that
the osmotic pressure has the form dG/dc 2 ]. Equation (22)
shows that a higher-than-equilibrium concentration fluc-
tuation will be opposed by the osmotic pressure.
If we let R θ be the change in light scattering caused
by concentration fluctuations, we can show that R θ is
related to osmotic pressure π by
KTRc 2
R θ = , (23)
(d π/dc 2 )
where
2 2
2π n (dn/dc 2 ) 2
K = . (24)
νλ 4
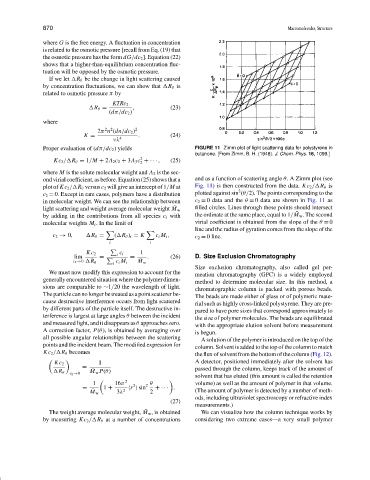
Proper evaluation of (d π/dc 2 ) yields FIGURE 11 Zimm plot of light scattering data for polystyrene in
butanone. [From Zimm, B. H. (1948). J. Chem. Phys. 16, 1099.]
2
Kc 2 / R θ = 1/M + 2A 2 c 2 + 3A 3 c + · · · , (25)
2
where M is the solute molecular weight and A 2 is the sec-
ond virial coefficient, as before. Equation (25) shows that a and as a function of scattering angle θ. A Zimm plot (see
plot of Kc 2 / R θ versus c 2 will give an intercept of 1/M at Fig. 11) is then constructed from the data. Kc 2 / R θ is
2
c 2 = 0. Except in rare cases, polymers have a distribution plotted against sin (θ/2). The points corresponding to the
in molecular weight. We can see the relationship between c 2 = 0 data and the θ = 0 data are shown in Fig. 11 as
¯ filled circles. Lines through these points should intersect
light scattering and weight average molecular weight M w
¯
by adding in the contributions from all species c i with the ordinate at the same place, equal to 1/ M w . The second
molecular weights M i . In the limit of virial coefficient is obtained from the slope of the θ = 0
line and the radius of gyration comes from the slope of the
c 2 → 0, R θ = ( R θ ) i = K c i M i , c 2 = 0 line.
i i
c
Kc 2 i i 1
lim = = . (26) D. Size Exclusion Chromatography
¯
c 2 →0 R θ c M w
i i M i
Size exclusion chromatography, also called gel per-
We must now modify this expression to account for the
meation chromatography (GPC) is a widely employed
generally encountered situation where the polymer dimen-
method to determine molecular size. In this method, a
sions are comparable to ∼1/20 the wavelength of light.
chromatographic column is packed with porous beads.
Theparticlecannolongerbetreatedasapointscattererbe-
The beads are made either of glass or of polymeric mate-
cause destructive interference occurs from light scattered
rial such as highly cross-linked polystyrene. They are pre-
by different parts of the particle itself. The destructive in-
pared to have pore sizes that correspond approximately to
terference is largest at large angles θ between the incident
the size of polymer molecules. The beads are equilibrated
and measured light, and it disappears as θ approaches zero.
with the appropriate elution solvent before measurement
A correction factor, P(θ), is obtained by averaging over
is begun.
all possible angular relationships between the scattering
A solution of the polymer is introduced on the top of the
points and the incident beam. The modified expression for
column. Solvent is added to the top of the column to match
Kc 2 / R θ becomes
the flux of solvent from the bottom of the column (Fig. 12).
A detector, positioned immediately after the solvent has
Kc 2 1
= passed through the column, keeps track of the amount of
¯
R θ M w P(θ)
c 2 →0
solvent that has eluted (this amount is called the retention
1
16π 2 2 2 θ volume) as well as the amount of polymer in that volume.
= ¯ 1 + 2 s sin + · · · . (The amount of polymer is detected by a number of meth-
M w 3λ 2
ods, including ultraviolet spectroscopy or refractive index
(27)
measurements.)
¯
The weight average molecular weight, M w , is obtained We can visualize how the column technique works by
by measuring Kc 2 / R θ at a number of concentrations considering two extreme cases—a very small polymer