
Page 134 - Engineered Interfaces in Fiber Reinforced Composites
P. 134
Chapter 4. Micromechanics of stress transJer 117
withstand an extremely large strain), it is most unlikely that the fully bonded model
can fully describe the relationship between (2L) and E during the whole fiber
fragmentation process for practical fiber composites.
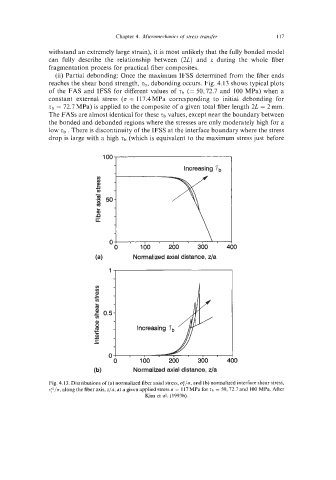
(ii) Partial debonding: Once the maximum IFSS determined from the fiber ends
reaches the shear bond strength, Zb, debonding occurs. Fig. 4.13 shows typical plots
of the FAS and IFSS for different values of Zb (= 50,72.7 and 100 MPa) when a
constant external stress (a = 117.4 MPa corresponding to initial debonding for
tb = 72.7 MPa) is applied to the composite of a given total fiber length 2L = 2 mm.
The FASs are almost identical for these Zb values, except near the boundary between
the bonded and debonded regions where the stresses are only moderately high for a
low zb . There is discontinuity of the IFSS at the interface boundary where the stress
drop is large with a high tb (which is equivalent to the maximum stress just before
1 00
Increasing 'Tb
VI
v)
E
-
c
rn
-3 50-
e
L
W
01
'0
J
v)
VI
E
c1
(0
9
5 0.5-
a,
0
C -
5 c
01
(b) Normalized axial distance, z/a
Fig. 4.13. Distributions of (a) normalized fiber axial stress, 4/u, and (b) normalized interface shear stress,
T;/CT, along the fiber axis, Z/U, at a given applied stress u = I17 MPa for ~b = 50,72.7 and 100 MPa. After
Kim et al. (1993b).