
Page 215 - Engineering Digital Design
P. 215
186 CHAPTER 4/LOGIC FUNCTION REPRESENTATION AND MINIMIZATION
\l DE D \ DE D
BC\ 00 01 11 10 ' BC\ 00 01 1 11 10
00 0 0 (T| 0 00 1 1 0 0
0 1 3 2 16 17 19 18
01 0 0 0 0 BDE 01 0 0 0 0
4 5. ^-~~~7 6 C j_ ~^^c 21 23 22
( — ^ Ny— -,
11 ( 1 1 ) 0 0 11 0 1 | 1 0
B 12 •4- 13 15 14 B 28 2E 31 3C
10 0 0 11 ^4 10 1 24 b, 1
8 bl 9 ^^ 27
^^ ^
E ^~ r-r " E ^
BCDE
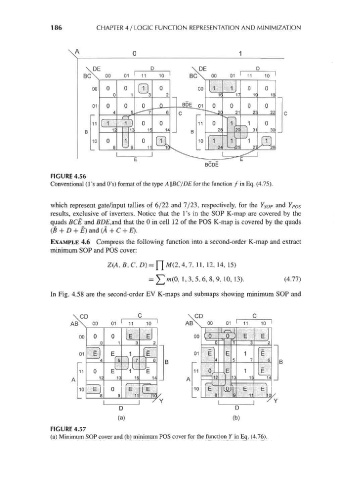
FIGURE 4.56
Conventional (1 's and O's) format of the type A \\BC/DE for the function / in Eq. (4.75).
which represent gate/input tallies of 6/22 and 7/23, respectively, for the Y SOp and Y POs
results, exclusive of inverters. Notice that the I's in the SOP K-map are covered by the
quads BCE and BDE,and that the 0 in cell 12 of the POS K-map is covered by the quads
(B + D + E) and (A + C + E).
EXAMPLE 4.6 Compress the following function into a second-order K-map and extract
minimum SOP and POS cover:
Z(A, B, C, D) = M(2, 4, 7, 11, 12, 14, 15)
= ]Tm(0, 1,3,5,6, 8, 9, 10, 13). (4.77)
In Fig. 4.58 are the second-order EV K-maps and submaps showing minimum SOP and
CD C \CD
AB\ 00 01 ' 11 10 1 AB\ 00 01 11 1 10
00 00
01 01
11 11
12 13 15 14 12 13 15
A
10 E 10
11 11 O/
J ^ Y
D D
(a) (b)
FIGURE 4.57
(a) Minimum SOP cover and (b) minimum POS cover for the function Y in Eq. (4.76).