
Page 383 - Engineering Electromagnetics, 8th Edition
P. 383
CHAPTER 10 Transmission Lines 365
Figure 10.36 See Problem 10.36.
10.37 In the transmission line of Figure 10.20, R g = Z 0 = 50 , and R L = 25 .
Determine and plot the voltage at the load resistor and the current in the
battery as functions of time by constructing appropriate voltage and current
reflection diagrams.
10.38 Repeat Problem 10.37, with Z 0 = 50 , and R L = R g = 25 . Carry out
the analysis for the time period 0 < t < 8l/ν.
10.39 In the transmission line of Figure 10.20, Z 0 = 50 , and R L = R g = 25 .
The switch is closed at t = 0 and is opened again at time t = l/4ν, thus
creating a rectangular voltage pulse in the line. Construct an appropriate
voltage reflection diagram for this case and use it to make a plot of the
voltage at the load resistor as a function of time for 0 < t < 8l/ν (note that
the effect of opening the switch is to initiate a second voltage wave, whose
value is such that it leaves a net current of zero in its wake).
10.40 In the charged line of Figure 10.25, the characteristic impedance is Z 0 =
100 , and R g = 300 . The line is charged to initial voltage, V 0 = 160 V,
and the switch is closed at t = 0. Determine and plot the voltage and current
through the resistor for time 0 < t < 8l/ν (four round-trips). This problem
accompanies Example 10.12 as the other special case of the basic
charged-line problem, in which now R g > Z 0 .
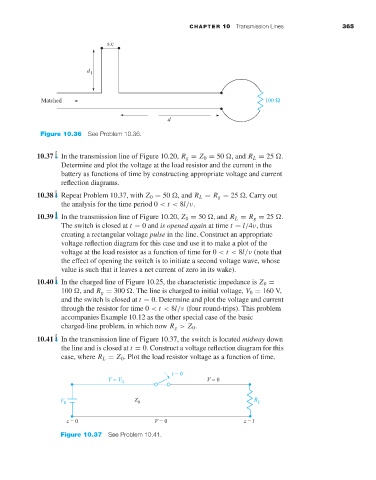
10.41 In the transmission line of Figure 10.37, the switch is located midway down
the line and is closed at t = 0. Construct a voltage reflection diagram for this
case, where R L = Z 0 . Plot the load resistor voltage as a function of time.
Figure 10.37 See Problem 10.41.