
Page 380 - Engineering Electromagnetics, 8th Edition
P. 380
362 ENGINEERING ELECTROMAGNETICS
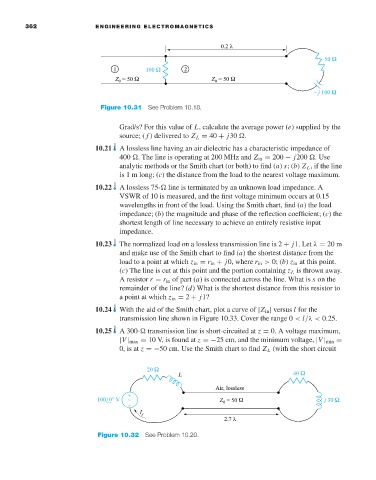
Figure 10.31 See Problem 10.18.
Grad/s? For this value of L, calculate the average power (e) supplied by the
source; ( f ) delivered to Z L = 40 + j30 .
10.21 A lossless line having an air dielectric has a characteristic impedance of
400 . The line is operating at 200 MHz and Z in = 200 − j200 . Use
analytic methods or the Smith chart (or both) to find (a) s;(b) Z L ,if the line
is 1 m long; (c) the distance from the load to the nearest voltage maximum.
10.22 A lossless 75- line is terminated by an unknown load impedance. A
VSWR of 10 is measured, and the first voltage minimum occurs at 0.15
wavelengths in front of the load. Using the Smith chart, find (a) the load
impedance; (b) the magnitude and phase of the reflection coefficient; (c) the
shortest length of line necessary to achieve an entirely resistive input
impedance.
10.23 The normalized load on a lossless transmission line is 2 + j1. Let λ = 20 m
and make use of the Smith chart to find (a) the shortest distance from the
load to a point at which z in = r in + j0, where r in > 0; (b) z in at this point.
(c) The line is cut at this point and the portion containing z L is thrown away.
A resistor r = r in of part (a)is connected across the line. What is s on the
remainder of the line? (d) What is the shortest distance from this resistor to
a point at which z in = 2 + j1?
10.24 With the aid of the Smith chart, plot a curve of |Z in | versus l for the
transmission line shown in Figure 10.33. Cover the range 0 < l/λ < 0.25.
10.25 A 300- transmission line is short-circuited at z = 0. A voltage maximum,
|V | max = 10 V, is found at z =−25 cm, and the minimum voltage, |V | min =
0, is at z =−50 cm. Use the Smith chart to find Z L (with the short circuit
L
Figure 10.32 See Problem 10.20.