Page 375 - Engineering Electromagnetics, 8th Edition
P. 375

CHAPTER 10   Transmission Lines           357

                     and reflected waves, which occur (in time) at each integer multiple of 2l/ν. So, when
                     moving up the axis, we add the voltages of both wavesto our total at each occurrence.
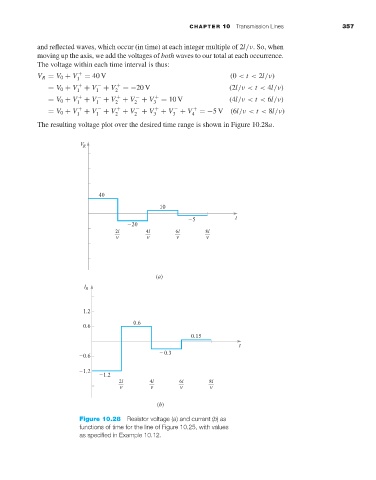
                     The voltage within each time interval is thus:
                     V R = V 0 + V 1 +  = 40 V                            (0 < t < 2l/ν)
                        = V 0 + V + V + V 2 +  =−20 V                    (2l/ν < t < 4l/ν)
                                +
                                     −
                                     1
                                1
                        = V 0 + V + V + V + V + V    3 +  = 10 V         (4l/ν < t < 6l/ν)
                                     −
                                                −
                                           +
                                +
                                     1
                                          2
                                1
                                               2
                        = V 0 + V + V + V + V + V + V + V      4 +  =−5V  (6l/ν < t < 8l/ν)
                                                          −
                                                     +
                                           +
                                                −
                                +
                                     −
                                1
                                                     3
                                                          3
                                     1
                                          2
                                               2
                     The resulting voltage plot over the desired time range is shown in Figure 10.28a.


                                 Figure 10.28 Resistor voltage (a) and current (b)as
                                 functions of time for the line of Figure 10.25, with values
                                 as specified in Example 10.12.
   370   371   372   373   374   375   376   377   378   379   380