
Page 373 - Engineering Electromagnetics, 8th Edition
P. 373
CHAPTER 10 Transmission Lines 355
in fact be negative (or of opposite sign to V 0 ). The line discharge process is analyzed
by keeping track of V as it propagates and undergoes multiple reflections at the two
+
1
ends. Voltage and current reflection diagrams are used for this purpose in much the
same way as before.
Referring to Figure 10.25, we see that for positive V 0 the current flowing through
the resistor will be counterclockwise and hence negative. We also know that continuity
requires that the resistor current be equal to the current associated with the voltage
wave, or
V +
I R = I 1 + = 1
Z 0
Now the resistor voltage will be
V +
V R = V 0 + V + =−I R R g =−I R g =− 1 R g
+
1
1
Z 0
where the minus signs arise from the fact that V R (having positive polarity) is produced
by the negative current, I R .We solve for V to obtain
+
1
−V 0 Z 0
V + = (122)
1
Z 0 + R g
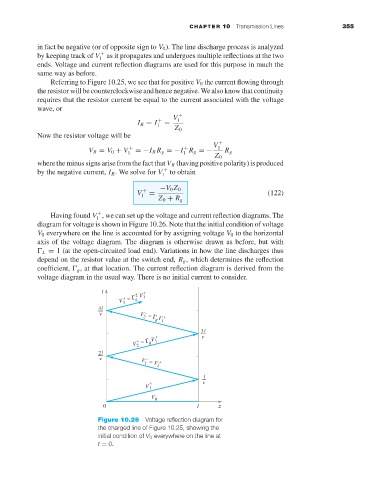
Having found V ,we can set up the voltage and current reflection diagrams. The
+
1
diagram for voltage is shown in Figure 10.26. Note that the initial condition of voltage
V 0 everywhere on the line is accounted for by assigning voltage V 0 to the horizontal
axis of the voltage diagram. The diagram is otherwise drawn as before, but with
L = 1 (at the open-circuited load end). Variations in how the line discharges thus
depend on the resistor value at the switch end, R g , which determines the reflection
coefficient, g ,at that location. The current reflection diagram is derived from the
voltage diagram in the usual way. There is no initial current to consider.
Figure 10.26 Voltage reflection diagram for
the charged line of Figure 10.25, showing the
initial condition of V 0 everywhere on the line at
t = 0.