
Page 374 - Engineering Electromagnetics, 8th Edition
P. 374
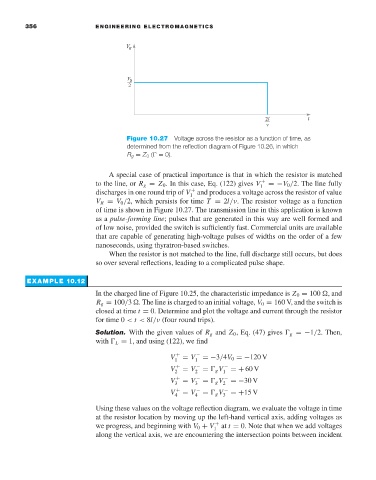
356                ENGINEERING ELECTROMAGNETICS


                                             Figure 10.27  Voltage across the resistor as a function of time, as
                                             determined from the reflection diagram of Figure 10.26, in which
                                              R g = Z 0 (  = 0).

                                        A special case of practical importance is that in which the resistor is matched
                                     to the line, or R g = Z 0 .In this case, Eq. (122) gives V 1 +  =−V 0 /2. The line fully
                                     discharges in one round trip of V and produces a voltage across the resistor of value
                                                               +
                                                               1
                                     V R = V 0 /2, which persists for time T = 2l/ν. The resistor voltage as a function
                                     of time is shown in Figure 10.27. The transmission line in this application is known
                                     as a pulse-forming line; pulses that are generated in this way are well formed and
                                     of low noise, provided the switch is sufficiently fast. Commercial units are available
                                     that are capable of generating high-voltage pulses of widths on the order of a few
                                     nanoseconds, using thyratron-based switches.
                                        When the resistor is not matched to the line, full discharge still occurs, but does
                                     so over several reflections, leading to a complicated pulse shape.

                  EXAMPLE 10.12
                                     In the charged line of Figure 10.25, the characteristic impedance is Z 0 = 100  , and
                                     R g = 100/3  . The line is charged to an initial voltage, V 0 = 160 V, and the switch is
                                     closed at time t = 0. Determine and plot the voltage and current through the resistor
                                     for time 0 < t < 8l/ν (four round trips).
                                     Solution. With the given values of R g and Z 0 , Eq. (47) gives   g =−1/2. Then,
                                     with   L = 1, and using (122), we find

                                                         V 1 +  = V 1 −  =−3/4V 0 =−120 V
                                                         V 2 +  = V 2 −  =   g V 1 −  =+ 60 V
                                                         V 3 +  = V 3 −  =   g V 2 −  =−30 V
                                                         V 4 +  = V 4 −  =   g V 3 −  =+15 V
                                     Using these values on the voltage reflection diagram, we evaluate the voltage in time
                                     at the resistor location by moving up the left-hand vertical axis, adding voltages as
                                     we progress, and beginning with V 0 + V at t = 0. Note that when we add voltages
                                                                     +
                                                                     1
                                     along the vertical axis, we are encountering the intersection points between incident