
Page 198 - Engineering Plastics Handbook
P. 198
Thermoplastic Polyetherimide (PEI) 171
10,000
Storage modulus (MPa) 100 BPADA-MPD-rich
1,000
PCE-rich
10
1
30 80 130 180 230
Temperature (°C)
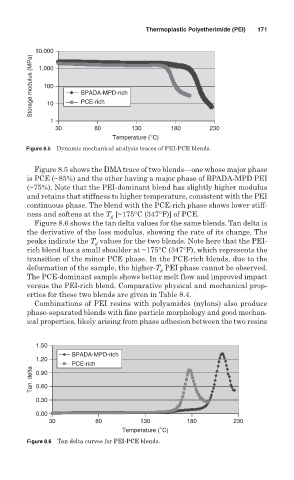
Figure 8.5 Dynamic mechanical analysis traces of PEI-PCE blends.
Figure 8.5 shows the DMAtrace of two blends—one whose major phase
is PCE (~85%) and the other having a major phase of BPADA-MPD PEI
(~75%). Note that the PEI-dominant blend has slightly higher modulus
and retains that stiffness to higher temperature, consistent with the PEI
continuous phase. The blend with the PCE-rich phase shows lower stiff-
ness and softens at the T [~175°C (347°F)] of PCE.
g
Figure 8.6 shows the tan delta values for the same blends. Tan delta is
the derivative of the loss modulus, showing the rate of its change. The
peaks indicate the T values for the two blends. Note here that the PEI-
g
rich blend has a small shoulder at ~175°C (347°F), which represents the
transition of the minor PCE phase. In the PCE-rich blends, due to the
deformation of the sample, the higher-T PEI phase cannot be observed.
g
The PCE-dominant sample shows better melt flow and improved impact
versus the PEI-rich blend. Comparative physical and mechanical prop-
erties for these two blends are given in Table 8.4.
Combinations of PEI resins with polyamides (nylons) also produce
phase-separated blends with fine particle morphology and good mechan-
ical properties, likely arising from phase adhesion between the two resins
1.50
BPADA-MPD-rich
1.20
PCE-rich
Tan. delta 0.90
0.60
0.30
0.00
30 80 130 180 230
Temperature (°C)
Figure 8.6 Tan delta curves for PEI-PCE blends.